????????????
ベイズ推論による機械学習入門 須山 敦志 著 を読む
????????????
Simpe 2D Gauss
????????????
demo_Simple2DGauss.jlも自作モジュール無しなので、ぐいぐい入力実行へ:
|
1 2 3 4 5 6 7 8 9 10 11 12 13 |
################################### ## Simple VI & GS for 2D Gaussian using PyPlot using Distributions function calc_KL(mu1, lambda1, mu2, lambda2) D = size(mu1, 1) px_lnqx = 0.5 * logdet(lambda2) - 0.5 * ((mu1 - mu2)' * lambda2 * (mu1 - mu2) + trace(lambda2 * inv(lambda1))) px_lnpx = 0.5 * logdet(lambda1) - 0.5 * D KL = - (px_lnqx - px_lnpx) return KL[1] end |
Out: calc_KL (generic function with 1 method)
|
1 2 3 4 5 6 7 8 9 10 11 12 13 14 15 16 |
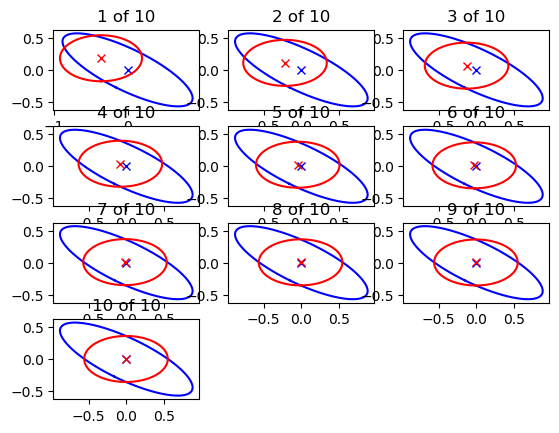
function plot_results(result, truth) N = size(result, 1) H = Int(ceil(sqrt(N))) W = Int(ceil(N / H)) for i in 1 : H for j in 1 : W n = (i - 1) * W + j if n <= N subplot(H, W, n) title("$n of $N") plot_gaussian(truth[1], truth[2], "b", "\$p(z)\$") plot_gaussian(result[n][1], result[n][2], "r", "\$p(z)\$") end end end end |
Out: plot_results (generic function with 1 method)
|
1 2 3 4 5 6 7 8 9 10 11 12 13 |
function plot_lines(X) D, N = size(X) X_d = zeros(D, 2*N + 1) X_d[:,1] = X[:,1] for i in 1 : N X_d[1, 2*i - 1] = X[1, i] X_d[1, 2*i] = X[1, i] X_d[2, 2*i] = X[2, i] X_d[2, 2*i + 1] = X[2, i] end plot(X[1,:], X[2,:], "oy") plot(X_d[1,1:2*N], X_d[2,1:2*N], "--y") end |
Out: plot_lines (generic function with 1 method)
|
1 2 3 4 5 6 7 8 9 10 11 12 13 14 15 16 17 18 |
function plot_gaussian(Mu, Sigma, col, label) res = 100 plot(Mu[1], Mu[2], "x", color=col) F = eigfact(Sigma) vec = F.vectors val = F.values dw = 2*pi/res w = dw * (0 : res) c = 1.0 a = sqrt(c*val[1]) b = sqrt(c*val[2]) P1 = a*cos.(w) P2 = b*sin.(w) P = Mu .+ vec'*vcat(P1', P2') plot(P[1, :], P[2, :], "-", color=col, label=label) end |
Out: plot_gaussian (generic function with 1 method)
|
1 2 3 4 5 6 7 8 9 10 11 12 13 14 15 16 17 18 19 20 21 22 23 24 25 26 27 28 29 30 31 32 33 34 35 36 37 38 39 40 41 42 43 44 45 46 47 48 49 50 51 52 53 54 55 56 57 |
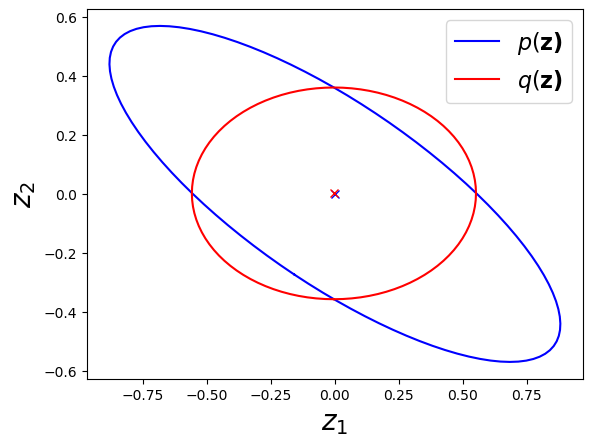
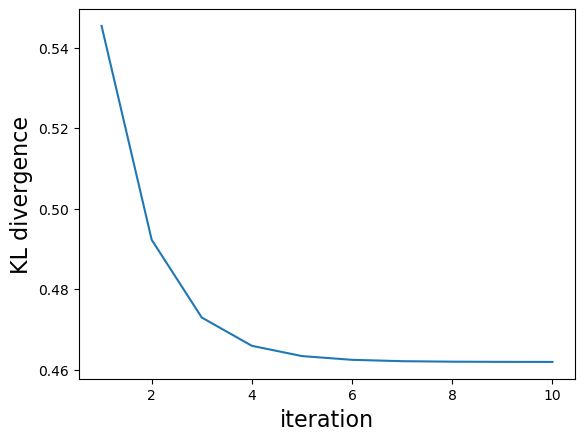
""" Variational inference for 2D Gauss. """ function main_VI() ## creat truth distribution D = 2 # dimension theta = 2.0*pi/12 # tilt A = reshape([cos.(theta), -sin.(theta), sin.(theta), cos.(theta)], 2, 2) mu = [0.0, 0.0] lambda = inv(A * inv(reshape([1,0,0,10], 2, 2)) * A') ## initialize #mu_h = randn(D) mu_h = [-0.5, 0.3] lambda_h = zeros(D,D) ## main iteration max_iter = 10 KL = NaN * Array{Float64, 1}(max_iter) result = Array{Any, 1}(max_iter) for i in 1 : max_iter ## update mu_h[1] = mu[1] - inv(lambda[1,1])*lambda[1,2] * (mu_h[2] - mu[2]) lambda_h[1,1] = lambda[1,1] mu_h[2] = mu[2] - inv(lambda[2,2])*lambda[2,1] * (mu_h[1] - mu[1]) lambda_h[2,2] = lambda[2,2] ## calculate KL divergeince KL[i] = calc_KL(mu_h, lambda_h, mu, lambda) ## store the results result[i] = [deepcopy(mu_h), deepcopy(inv(lambda_h))] end ## visualize results figure("result per iteration (VI)") clf() plot_results(result, (mu, inv(lambda))) figure("result (VI)") clf() plot_gaussian(mu, inv(lambda), "b", "\$p(\\bf{z})\$") plot_gaussian(result[end][1], result[end][2], "r", "\$q(\\bf{z})\$") xlabel("\$z_1\$", fontsize=20) ylabel("\$z_2\$", fontsize=20) legend(fontsize=16) figure("KL divergence (VI)") clf() plot(1:max_iter, KL) ylabel("KL divergence", fontsize=16) xlabel("iteration", fontsize=16) show() end |
Out: main_VI
|
1 2 3 4 5 6 7 8 9 10 11 12 13 14 15 16 17 18 19 20 21 22 23 24 25 26 27 28 29 30 31 32 33 34 35 36 37 38 39 40 41 42 43 44 45 46 47 48 49 50 51 52 53 54 55 |
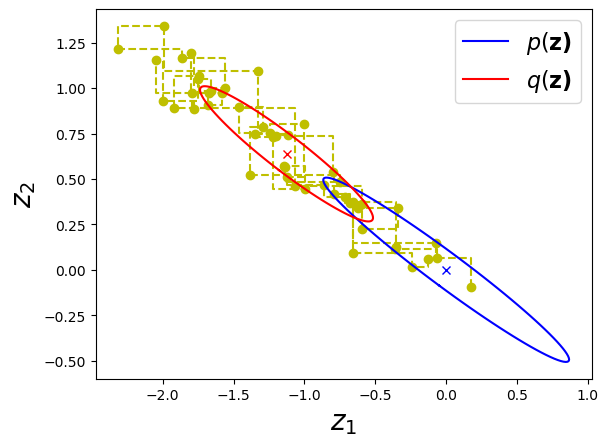
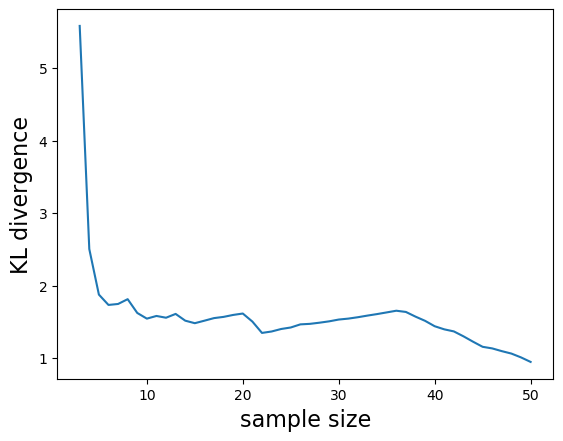
""" Gibbs sampling for 2D Gauss. """ function main_GS() ## creat truth distribution D = 2 # dimension theta = 2.0*pi/12 # tilt A = reshape([cos.(theta), -sin.(theta), sin.(theta), cos.(theta)], 2, 2) mu = [0.0, 0.0] #lambda = inv(A * inv(reshape([1,0,0,10], 2, 2)) * A') lambda = inv(A * inv(reshape([1,0,0,100], 2, 2)) * A') ## initialize #max_iter = 1000 max_iter = 50 X = randn(D, max_iter) mu_h = randn(D) ## main iteration KL = NaN * Array{Float64, 1}(max_iter) for i in 2 : max_iter ## update mu_h[1] = mu[1] - inv(lambda[1,1])*lambda[1,2] * (X[2,i-1] - mu[2]) X[1, i] = rand(Normal(mu_h[1], sqrt(inv(lambda[1,1])))) mu_h[2] = mu[2] - inv(lambda[2,2])*lambda[2,1] * (X[1,i] - mu[1]) X[2, i] = rand(Normal(mu_h[2], sqrt(inv(lambda[2,2])))) if i > D KL[i] = calc_KL(mean(X[:,1:i], 2), inv(cov(X[:,1:i], 2)), mu, lambda) end end ## visualize results expt_mu = mean(X, 2) expt_Sigma = cov(X, 2) figure("samples (GS)") clf() plot_lines(X) plot_gaussian(mu, inv(lambda), "b", "\$p(\\bf{z})\$") plot_gaussian(expt_mu, expt_Sigma, "r", "\$q(\\bf{z})\$") xlabel("\$z_1\$", fontsize=20) ylabel("\$z_2\$", fontsize=20) legend(fontsize=16) figure("KL divergence (GS)") clf() plot(1:max_iter, KL) ylabel("KL divergence", fontsize=16) xlabel("sample size", fontsize=16) show() end |
main_GS
|
1 |
main_VI() |
|
1 |
main_GS() |
