????????????
ベイズ推論による機械学習入門 須山 敦志 著 を読む
????????????
Bayesian Poisson Mixture Model
????????????
モジュールBayesian Poisson Mixture Modelをドンと導入してから、demoへ
|
1 2 3 4 5 6 7 8 9 10 11 12 13 14 15 16 17 18 19 20 21 22 23 24 25 26 27 28 29 30 31 32 33 34 |
""" Bayesian Poisson Mixture Model """ module PoissonMixtureModel using StatsFuns.logsumexp, SpecialFunctions.digamma using Distributions export Gam, BPMM, Poi, PMM export sample_PMM, sample_data, winner_takes_all export learn_GS, learn_CGS, learn_VI 途中省略...... """ Compute posterior distribution via collapsed Gibbs sampling. """ function learn_CGS(X::Matrix{Float64}, prior_bpmm::BPMM, max_iter::Int) # initialisation S = init_S(X, prior_bpmm) bpmm = add_stats(prior_bpmm, X, S) VB = NaN * zeros(max_iter) # inference for i in 1 : max_iter # directly sample S S, bpmm = sample_S_CGS(S, X, bpmm) # calc VB VB[i] = calc_ELBO(X, prior_bpmm, bpmm) end return S, bpmm, VB end end |
Out:PoissonMixtureModel
|
1 |
using PoissonMixtureModel |
モジュール導入が成功したので、demo_PoissonMixtureMode.jlへ
|
1 2 3 4 5 6 7 |
################################### ## Example code ## for Bayesian Poisson Mixture Model push!(LOAD_PATH,"/Users/******Desktop/BayesBook-master/src") using PyPlot, PyCall import PoissonMixtureModel |
|
1 2 3 4 5 6 7 8 9 10 11 12 13 14 15 16 17 18 19 20 21 22 23 24 25 26 |
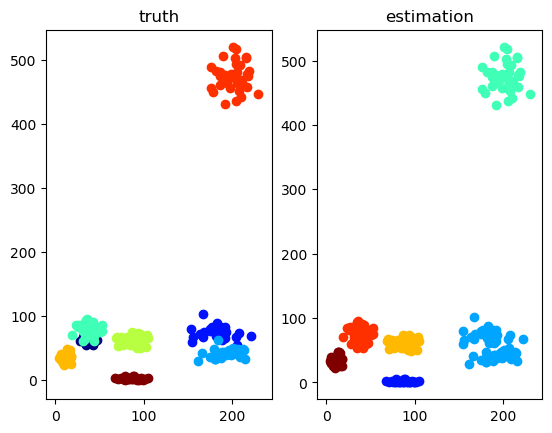
""" Visualize data & estimation in 2D space. """ function visualize_2D(X::Matrix{Float64}, S::Matrix{Float64}, S_est::Matrix{Float64}, text) cmp = get_cmap("jet") K1 = size(S, 1) K2 = size(S_est, 1) col1 = [pycall(cmp.o, PyAny, Int(round(val)))[1:3] for val in linspace(0,255,K1)] col2 = [pycall(cmp.o, PyAny, Int(round(val)))[1:3] for val in linspace(0,255,K2)] f, (ax1, ax2) = subplots(1,2,num=text) f[:clf]() f, (ax1, ax2) = subplots(1,2,num=text) for k in 1 : K1 ax1[:scatter](X[1, S[k,:].==1], X[2, S[k,:].==1], color=col1[k]) end ax1[:set_title]("truth") for k in 1 : K2 ax2[:scatter](X[1, S_est[k,:].==1], X[2, S_est[k,:].==1], color=col2[k]) end ax2[:set_title]("estimation") end |
Out: visualize_2D
|
1 2 3 4 5 6 7 8 9 10 11 |
function draw_hist(ax, X, S, label) counts, bins, patches = ax[:hist](X', 20) for i in 1 : length(patches) if counts[i] > 0 S_tmp = S[:,bins[i] .<= X[1,:] .<= bins[i+1]] S_sum = sum(S_tmp, 2) / sum(S_tmp) patches[i][:set_facecolor]((S_sum[1], 0, S_sum[2])) end end ax[:set_title](label) end |
draw_hist (generic function with 1 method)
|
1 2 3 4 5 6 7 8 9 10 11 12 13 14 15 |
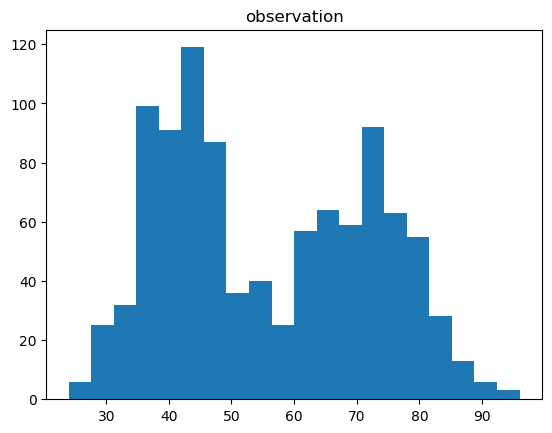
""" Visualize data & estimation using 1D histogram. """ function visualize_1D(X::Matrix{Float64}, S::Matrix{Float64}, S_est::Matrix{Float64}) # separated figures f1, ax1 = subplots(1,1,num="observation") f2, ax2 = subplots(1,1,num="estimation") f1[:clf]() f2[:clf]() _, ax1 = subplots(1,1,num="observation") _, ax2 = subplots(1,1,num="estimation") ax1[:hist](X', 20) ax1[:set_title]("observation") draw_hist(ax2, X, S_est, "estimation") end |
Out: visualize_1D
|
1 2 3 4 5 6 7 8 9 10 11 12 13 14 15 16 17 18 19 20 21 22 23 24 25 26 27 28 29 30 31 32 33 34 |
""" Run a test script for 1D data clustering. """ function test_1D() ## set model D = 1 # data dimension, must be 1. K = 2 # number of mixture components, must be 2. alpha = 100.0 * ones(K) cmp = [PoissonMixtureModel.Gam(1.0*ones(D), 0.01) for i in 1 : K] bpmm = PoissonMixtureModel.BPMM(D, K, alpha, cmp) ## generate data N = 1000 pmm = PoissonMixtureModel.sample_PMM(bpmm) X, S = PoissonMixtureModel.sample_data(pmm, N) ## inference max_iter = 100 tic() S_est, post_bpmm, VB = PoissonMixtureModel.learn_VI(X, bpmm, max_iter) #S_est, post_bpmm, VB = PoissonMixtureModel.learn_GS(X, bpmm, max_iter) #S_est, post_bpmm, VB = PoissonMixtureModel.learn_CGS(X, bpmm, max_iter) toc() ## plot visualize_1D(X, S, S_est) figure("ELBO") clf() plot(VB) ylabel("ELBO") xlabel("iterations") show() end |
Out: test_1D
|
1 2 3 4 5 6 7 8 9 10 11 12 13 14 15 16 17 18 19 20 21 22 23 24 25 26 27 28 29 30 31 32 33 34 35 36 37 |
""" Run a test script for 2D data clustering. """ function test_2D() ## set model D = 2 # data dimension, must be 2. K = 8 # number of mixture components #K = 5 alpha = 100.0 * ones(K) cmp = [PoissonMixtureModel.Gam(1.0*ones(D), 0.01) for i in 1 : K] bpmm = PoissonMixtureModel.BPMM(D, K, alpha, cmp) ## generate data N = 300 pmm = PoissonMixtureModel.sample_PMM(bpmm) X, S = PoissonMixtureModel.sample_data(pmm, N) ## inference max_iter = 100 tic() S_est, post_bpmm, VB = PoissonMixtureModel.learn_VI(X, bpmm, max_iter) #S_est, post_bpmm, VB = PoissonMixtureModel.learn_GS(X, bpmm, max_iter) #S_est, post_bpmm, VB = PoissonMixtureModel.learn_CGS(X, bpmm, max_iter) toc() ## plot visualize_2D(X, S, PoissonMixtureModel.winner_takes_all(S_est), "2D plot") # VB check figure("ELBO") clf() plot(VB) ylabel("ELBO") xlabel("iterations") show() end |
Out: test_2D
|
1 |
test_1D() |
|
1 |
test_2D() |

