Ref: Baysian Analysis with Python by Osvaldo Martin
——————————————————–
t分布を解析する。t分布の基本は、正規分布する母集団の平均と分散が未知で標本サイズが小さい場合に平均を推定することに用いられるということだった。t分布には自由度vという第三のパラメータがあり、このvが無限大となれば、正規分布に収束することとなる。
t分布と正規分布を比較すると、t分布のほうが、自由度が小さければ、分布の高さ(頂点)が低くなり、その分、裾野部分が少し広がる。
実用上はvが30以上で、ほぼ正規分布といわれる。
まずは、自由度を変動させて、分布を正規分布v=∞に近づけてみる。
|
1 2 3 4 5 6 7 8 9 10 11 12 13 |
x_values = np.linspace(-10, 10, 200) for df in [1, 2, 3, 4, 5, 6, 7, 8, 9, 10, 20, 30, 40, 50, 60, 70, 80, 90, 100]: distri = stats.t(df) x_pdf = distri.pdf(x_values) plt.plot(x_values, x_pdf, label=r'$\nu$ = {}'.format(df), linewidth = 0.8) x_pdf = stats.norm.pdf(x_values) plt.plot(x_values, x_pdf, label=r'$\nu = \infty$', linewidth = 0.8) plt.xlabel('$x$') plt.ylabel('$p(x)$') plt.legend(loc=0, fontsize=5) plt.xlim(-8, 8) plt.savefig('img_t0.png', dpi=300, figsize=(10, 10)) |
事前分布の設定は、
μ〜Uniform(l, h):平均値は一様分布
σ〜HalfNormal(σσ):標準偏差は半世紀分布
v〜Exponential(λ):自由度は、指数分布
尤度:
y〜StudentT(μ, σ, v)
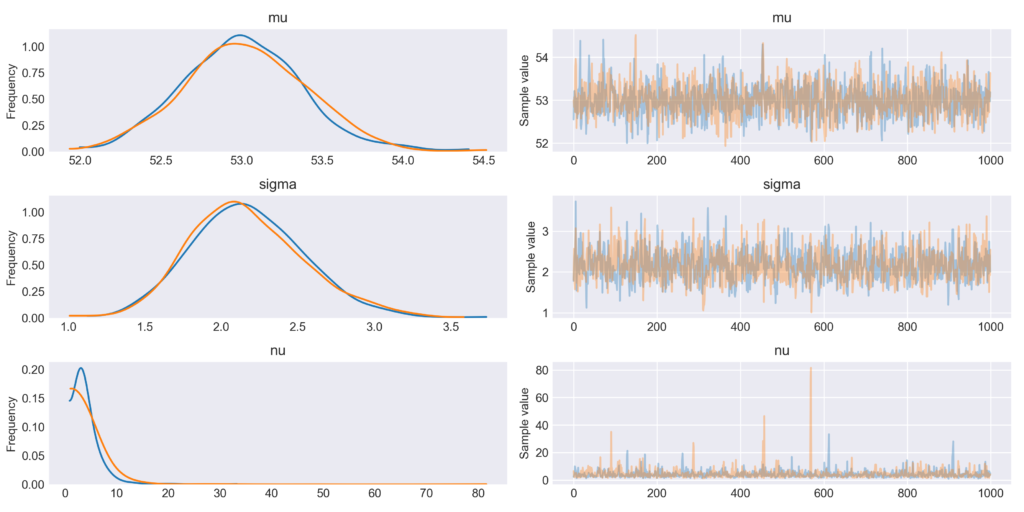
として、KDEとトレースプロットは、
|
1 2 3 4 5 6 7 8 9 10 |
with pm.Model() as model_t: mu = pm.Uniform('mu', 10, 80) sigma = pm.HalfNormal('sigma', sd=5) nu = pm.Exponential('nu', 1/30) y = pm.StudentT('y', mu=mu, sd=sigma, nu=nu, observed=data) trace_t = pm.sample(1100) chain_t = trace_t[100:] pm.traceplot(chain_t) plt.savefig('img_t1.png', dpi=300, figsize=(5.5, 5.5)) |
|
1 2 3 4 5 |
Auto-assigning NUTS sampler... Initializing NUTS using jitter+adapt_diag... Multiprocess sampling (2 chains in 2 jobs) NUTS: [nu, sigma, mu] Sampling 2 chains: 100%|??????????| 3200/3200 [00:02<00:00, 1133.07draws/s] |
|
1 2 3 4 5 6 7 8 9 10 |
pm.summary(chain_t) y_pred = pm.sample_posterior_predictive(chain_t, 20, model_t, size=len(list)) for i in y_pred['y'].reshape(960,48): sns.kdeplot(i, color='r', alpha=0.1) sns.kdeplot(data, color='b') plt.xlim(35, 75) plt.title("Student's t model", fontsize=16) plt.xlabel('$x$', fontsize=16) plt.savefig('img_t2.png', dpi=300, figsize=(5.5, 5.5)) |


