Bayesian Biostatistics by E Lesaffre & AB Lawson, Chapter 6 学習ノート
ーーーーーーーーーーーーーーーーーーーーーーーーーーーーーーーーーーーーー
2週間ばかし、別件にトラップされたので、また一からギブス・サンプリングをチェックする。
6.2 ギブス・サンプラー
6.2.1 2変量ギブス・サンプラー
例V.I血清アルカリフォスファターゼ研究:ギブス・サンプリングによる事後分布ー無情報事前分布ー
250名の健常人の血清アルカリフォスファターゼの測定にもとづく正規尤度の事後分布からサンプリングを行う。
|
1 2 3 4 5 6 7 8 9 10 11 12 13 14 15 16 |
> attach(ALP) > objects(2) [1] "alkfos" "artikel" > alp <- alkfos[artikel==0] > talp <- 100*alp^(-1/2) > mtalp <- mean(talp) > vartalp <- var(talp) > sdtalp <- sqrt(var(talp)) > ntalp <- length(talp) > ntalp;mtalp;sdtalp;vartalp [1] 250 [1] 7.108724 [1] 1.365344 [1] 1.864165 > length(alp) [1] 250 |
ふたつの条件付き分布p(μ|σ^2,y)とp(σ^2|μ,y)を設定する。
N((μ|y_bar, σ^2/n)
pp(σ^2|μ,y)は、Inv-χ^2(σ^2|n,s_μ^2)分布である。ただしs_μ^2 = 1/nΣ(yi-μ)^2
ギブス・サンプラー
1.N((μ|y_bar, (σ^2)k/n)からμ(k+1)をサンプリングする。
2. Inv-χ^2(σ^2|n,s_μ(k+1)^2)から(σ^2)(k+1)をサンプリングする。
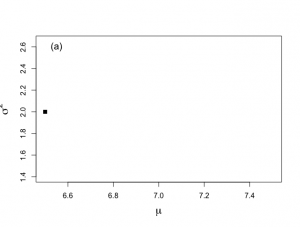
サンプリングの初期値をμ=6.5、σ^2=2としてスタート:
|
1 2 |
> start.x <- 6.5 #パラメータベクトル(μ, σ^2)の初期値 > start.y <- 2 > nchain <- 1500 |
次にθ1=μと、θ2=σ^2の1500サンプリング要素を収める配列、その倍の要素を持ったplot.1、plot.2配列を生成する。
|
1 2 3 4 |
> theta.1 <- rep(0,nchain) > theta.2 <- rep(0,nchain) > plot.1 <- rep(0,nchain*2) > plot.2 <- rep(0,nchain*2) |
set.seed()は乱数種を指定する関数で、常に同じ乱数を発生させられる。
|
1 2 3 4 5 6 7 8 |
> # Plot the first 5 elements of the chain in the (mu, sigma^2)-plane > # Figure 6-1(a) > > par(mfrow=c(1,2)) > par(pty="s") > par(mar = c(5,6,4,2)+0.1) > > set.seed(7933) |
カウンタichainとiplotに初期値1を挿入。初期値(6.5, 2)をtheta.1とtheta.2、plot.1とplot.2に挿入する。
|
1 2 3 4 5 6 |
> ichain <- 1 > iplot <- 1 > theta.1[ichain] <- start.x > theta.2[ichain] <- start.y > plot.1[iplot] <- start.x > plot.2[iplot] <- start.y |
|
1 |
> plot(start.x,start.y,xlab=expression(mu), ylab=expression(sigma^{2}),type="n",bty="o", xlim=c(6.5,7.5),ylim=c(1.4,2.65), main="",cex.lab=1.5) |
|
1 2 |
> points(start.x,start.y,cex=1.2,pch=15) > text(6.55,2.6,"(a)",cex=1.3) |
|
1 2 3 4 5 6 7 8 9 10 11 12 13 14 15 16 17 18 19 20 21 22 23 24 25 26 27 28 29 |
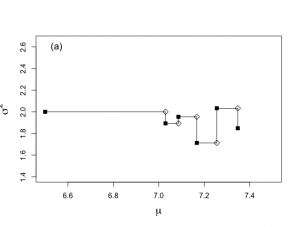
> while (ichain < nchain) { #ichoinがnchain=1500まで繰り返す + theta.1[ichain+1] <- rnorm(1,mtalp,sqrt(theta.2[ichain]/ntalp)) #正規分布(標本平均, √σ/標本数)からの乱数として発生させてθ1へ挿入 + + iplot <- iplot+1 #カウンタiplotを更新 + plot.1[iplot] <- theta.1[ichain+1] #θ1の値を更新する。 + plot.2[iplot] <- theta.2[ichain] #θ2の値は維持する。 + + if (ichain <= 5){ #ichainをカウンタにして5回繰り返す + segments(plot.1[iplot-1],plot.2[iplot-1],plot.1[iplot],plot.2[iplot]) + points(plot.1[iplot],plot.2[iplot],cex=1.2,pch=5)} #pch=5白菱:中間段階 + + phi.u <- rchisq(1,ntalp) #カイ二乗分布からの乱数サンプリング + theta.u <- 1/phi.u #上記カイ二乗分布からのサンプリングの逆数 + sstalpmu <- (talp-theta.1[ichain+1])%*%(talp-theta.1[ichain+1]) #(スケール化alp-μ)^2 #%*%は行列積: + sigma2.u <- sstalpmu*theta.u #スケール化逆χ二乗分布 + + theta.2[ichain+1] <- sigma2.u #σ^2をθ2へ挿入して更新 + + iplot <- iplot+1 #カウンタiplotを更新 + plot.1[iplot] <- theta.1[ichain+1] + plot.2[iplot] <- theta.2[ichain+1] + + if (ichain <= 5){ #ichainをカウンタにして5回繰り返す + segments(plot.1[iplot-1],plot.2[iplot-1],plot.1[iplot],plot.2[iplot]) + points(plot.1[iplot],plot.2[iplot],cex=1.2,pch=15)} #pch=15黒四角:ギブス連鎖の要素 + + ichain <- ichain +1 #カウンタichainを更新 + + } |
500回分繰り返してみると、
|
1 2 3 4 5 6 7 8 9 10 11 12 13 14 15 16 17 18 19 20 21 22 23 24 25 26 27 28 29 30 31 32 33 34 35 36 37 38 39 40 41 42 43 44 45 46 47 48 49 50 51 52 53 54 55 56 57 58 59 60 61 62 63 64 |
> start.x <- 6.5 > start.y <- 2 > > nchain <- 1500 > > theta.1 <- rep(0,nchain) > theta.2 <- rep(0,nchain) > > plot.1 <- rep(0,nchain*2) > plot.2 <- rep(0,nchain*2) > > # Plot the first 5 elements of the chain in the (mu, sigma^2)-plane > # Figure 6-1(a) > > par(mfrow=c(1,2)) > par(pty="s") > par(mar = c(5,6,4,2)+0.1) > > set.seed(7933) > > ichain <- 1 > iplot <- 1 > theta.1[ichain] <- start.x > theta.2[ichain] <- start.y > > plot.1[iplot] <- start.x > plot.2[iplot] <- start.y > > > plot(start.x,start.y,xlab=expression(mu), + ylab=expression(sigma^{2}),type="n",bty="o", + xlim=c(6.5,7.5),ylim=c(1.4,2.65),main="",cex.lab=1.5) > points(start.x,start.y,cex=1.2,pch=15) > text(6.55,2.6,"(a)",cex=1.3) > > while (ichain < nchain) { + theta.1[ichain+1] <- rnorm(1,mtalp,sqrt(theta.2[ichain]/ntalp)) + + iplot <- iplot+1 + plot.1[iplot] <- theta.1[ichain+1] + plot.2[iplot] <- theta.2[ichain] + + if (ichain <= 500){ + segments(plot.1[iplot-1],plot.2[iplot-1],plot.1[iplot],plot.2[iplot]) + points(plot.1[iplot],plot.2[iplot],cex=1.2,pch=5)} + + phi.u <- rchisq(1,ntalp) + theta.u <- 1/phi.u + sstalpmu <- (talp-theta.1[ichain+1])%*%(talp-theta.1[ichain+1]) + sigma2.u <- sstalpmu*theta.u + + theta.2[ichain+1] <- sigma2.u + + iplot <- iplot+1 + plot.1[iplot] <- theta.1[ichain+1] + plot.2[iplot] <- theta.2[ichain+1] + + if (ichain <= 500){ + segments(plot.1[iplot-1],plot.2[iplot-1],plot.1[iplot],plot.2[iplot]) + points(plot.1[iplot],plot.2[iplot],cex=1.2,pch=15)} + + ichain <- ichain +1 + + } |
|
1 2 3 4 5 |
> # Report the first five generated values > > theta.1[1:5];theta.2[1:5] [1] 6.500000 7.029487 7.086344 7.167274 7.255251 [1] 2.000000 1.893117 1.953866 1.712717 2.032907 |
|
1 2 3 4 5 6 7 8 |
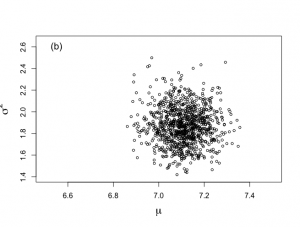
# Plot the last 1000 generated values # Figure 6-1(b) > nstart <- 501 > > burnin <- seq(1,nstart*2-3,2) > > nplot <- nchain*2-1 > isubplot <- seq(nstart*2-1,nplot,2) |
|
1 2 3 |
> plot(plot.1[isubplot],plot.2[isubplot],xlab=expression(mu), + ylab=expression(sigma^{2}),type="n",bty="o", + xlim=c(6.5,7.5),ylim=c(1.4,2.65),main="",cex.lab=1.5) |
|
1 2 |
> points(plot.1[isubplot],plot.2[isubplot],cex=0.7,pch=1) > text(6.55,2.6,"(b)",cex=1.3) |
burn-inとして捨て去る500回分のデータは、
|
1 2 3 4 5 6 7 8 9 10 11 12 13 14 15 16 17 18 19 20 21 22 23 24 25 26 27 28 29 30 31 32 33 34 |
unl.mu <- 6.8 upl.mu <- 7.4 unl.sigma2 <- 1.2 upl.sigma2 <- 2.5 # True distributions # To compare with the sampled histograms > nmu <- 50 > nsigma2 <- 50 > ntilde <- 50 > > mu <- seq(unl.mu,upl.mu,length=nmu) > mus <- (mu-mtalp)/(sdtalp/sqrt(ntalp)) > pmu <- dt(mus,ntalp-1)*sqrt(ntalp)/sdtalp #t分布dt(mus, n-1)*√n/s > sigma2 <- seq(unl.sigma2,upl.sigma2,length=nsigma2) > sigma2s <- (ntalp-1)*vartalp/sigma2 > psigma2 <- dchisq(sigma2s,ntalp-1)*(ntalp-1)*vartalp/(sigma2^2) > > # Estimates of marginal posterior distributions based on Gibbs sampler > # Prior to convergence, figure not included in the book > > par(mfrow=c(1,2)) > par(pty="s") > hist(plot.1[burnin],xlab=expression(mu),ylim=c(0,max(pmu)), + ylab="",main="", nclas=30,prob=T,cex.lab=1.5,col="light blue", + cex.axis=1.3) > lines(mu,pmu,lwd=3,lty=1) > > hist(plot.2[burnin],xlab=expression(sigma^{2}),ylim=c(0,max(psigma2)), + ylab="", nclas=30,prob=T,main="",cex.lab=1.5,col="light blue", + cex.axis=1.3) > lines(sigma2,psigma2,lwd=3,lty=1) > |
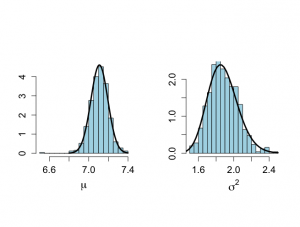
最終的な1000回のパラメータの分布は、
|
1 2 3 4 5 6 7 8 9 10 11 12 13 14 |
# After burn-in part # Figure 6.2 par(mfrow=c(1,2)) par(pty="s") hist(plot.1[isubplot],xlab=expression(paste(mu)),ylab="", nclas=30,prob=T,main="",cex.lab=1.5,col="light blue") lines(mu,pmu,lwd=3,lty=1) text(6.87,4.5,"(a)",cex=1.3) hist(plot.2[isubplot],xlab=expression(paste(sigma^{2})),ylab="", nclas=30,prob=T,main="",cex.lab=1.5,col="light blue") lines(sigma2,psigma2,lwd=3,lty=1) text(1.5,2.4,"(b)",cex=1.3) |
ギブス・サンプリングは、
http://d.hatena.ne.jp/hoxo_m/20140911/p1
で以下のようにじょうずに?明されている。
y の値を固定した条件付き分布から x の次候補をサンプリングする
x の値を固定した条件付き分布から y の次候補をサンプリングする
ということを交互に行うシンプルな手法。
「やはりこのアルゴリズムも、次の状態が前の状態によって決まる(マルコフ連鎖)、確率を使ったアルゴリズム(モンテカルロ法)であることが分かる。ギブス・サンプラーは、メトロポリス法を一般化した「メトロポリス・ヘイスティングス法」の一種で、必ず r = 1 となるため、得られた候補を棄却しなくて済む。これは非常に強力な手法なのだが、アルゴリズムの性質上、条件付き分布からのサンプリングが容易にできる場合にしか適用できない。運の良いことに、階層ベイズモデルではこれが容易にできるので、ベイズ統計ではよく使われている。」
今回の例も、μとσ^2が未知の正規分布に従うデータで、無情報事前分布に正規尤度で、μは正規分布で、σを固定した場合、tn-1(μ,s^2/n)の分布、σ^2はスケール化逆カイ二乗分布に従うというように、事後分布が解析的に解っている場合、事後分布の要約(今回の例のように、正規分布の場合は、平均値と分散の分布)を求めるのに有効な手法となると言うことで理解。
例VI.2: 離散分布 x 連続分布からのサンプリング
離散分布の代表であるベータ二項分布BB(n, α, β)の例だと、n回のトライアルで確率yでもって成功する事象がx回起こる確率分布
f(x,y) ∝ (n x)* y^(x+α-1) * (1-y)^(n-x+β-1)
これをf(x|y)とf(y|x) と順番にyとxを固定して、ギブスサンプリングする。
f(x,y) ∝ (n x) * y^x * (1-y)^(n-x) * y^(α-1) * y^(β-1)
とすれば、f(x|y)を得るには、xに依存しないy^(α-1) * y^(β-1)を取り除き、Bin(n,y) = y^x * (1-y)^(n-x)、同様にf(y|x)はBeta(x+α, n-x+β)。
従って、(k+1)回目のギブス・サンプリングの反復手順は、
1. Bin(n, y^k)からx(k+1)をサンプリングする
2. Beta(x^(k+1)+α, n-x^'(k+1) + β)からy^(k+1)をサンプリングする。
|
1 2 3 4 5 6 7 8 9 10 11 12 13 14 15 16 17 18 19 20 21 22 23 24 25 26 27 28 29 30 31 32 33 34 35 36 37 38 39 40 41 42 43 44 45 46 47 48 49 50 51 52 53 54 55 |
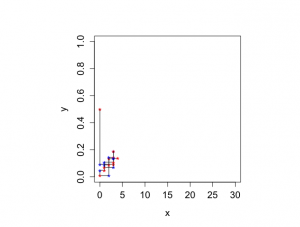
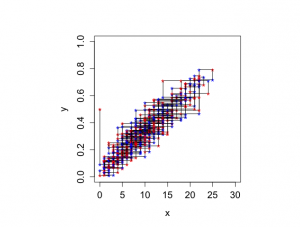
> library(DAAG) 要求されたパッケージ lattice をロード中です > > set.seed(117) > > n <- 30 > > alpha <- 2 > beta <- 4 > > > # k GIBBS Samples > > k <- 1500 > > xval <- rep(0,k) > yval <- rep(0,k) > > xval[1] <- 0 > yval[1] <- 0.5 > > > for (kiter in 2:k){ + yval[kiter] <- rbeta(1,xval[kiter-1]+alpha,n-xval[kiter-1]+beta) + xval[kiter] <- rbinom(1,n,yval[kiter]) + } > > # Zig-zag plot of first 10 iterations > # Input from the user is requested by the function `pause' > # To see what goes on when Gibbs sampling > # Graph is not included in the book > > par(mfrow=c(1,1)) > par(pty="s") > par(mar = c(5,6,4,2)+0.1) > > minx <- 0 > maxx <- n > > miny <- 0 > maxy <- 1 > > plot(xval,yval,xlim=c(minx,maxx),ylim=c(miny,maxy),bty="o", + xlab="x",ylab="y", main="",cex.lab=1.3,cex=1.2,cex.axis=1.3,type="n") > > text(xval[1],yval[1],"*",cex=1.3,col="red") > > for (i in 1:10){ + segments(xval[i],yval[i],xval[i],yval[i+1]) + text(xval[i],yval[i+1],"*",cex=1.3,col="blue") + segments(xval[i],yval[i+1],xval[i+1],yval[i+1]) + text(xval[i+1],yval[i+1],"*",cex=1.3,col="red") + pause() + } Pause. Press <Enter> to continue... |
|
1 2 3 4 5 6 7 8 9 10 11 12 13 14 15 16 17 18 19 20 21 22 |
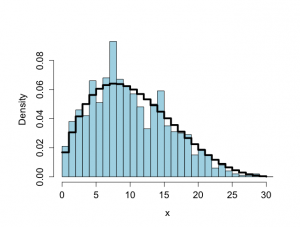
> # Histogram of x-values > # Figure 6.3 > > x <- seq(0,n,1) > > ldbetabinom <- log(choose(n,x))+lgamma(alpha+beta) - lgamma(alpha) - + lgamma(beta) + lgamma(x+alpha)+ lgamma(n-x+beta) - lgamma(alpha+beta+n) > dbetabinom <- exp(ldbetabinom) > > vbreaks <- seq(-0.00001,31.00001,1) > > burnin <- 501 > mul <- k-burnin > > par(mfrow=c(1,1)) > par(pty="m") > > hist(xval[(burnin+1):k],xlab="x", + breaks=vbreaks,main="",col="light blue", + cex.lab=1.3,cex=1.2,cex.axis=1.3,prob=T) > > lines(x,dbetabinom,type="s",lwd=4) |
例VI.3 血清アルカリフォスファターゼ研究:ギブス・サンプリングによる事後分布ー準共役事前分布
今度は、情報のある事前分布をパラメータに与える場合。
μの事前分布として正規分布N(μ0,σ0)、σ^2の事前分布としてInv-χ^2(v0, τ^2)
μとσ^2の事後分布は、、2つの独立した事前分布と尤度の積
p(μ, σ^2|y) α 正規分布 * 尤度の積Π =複雑な式
事前分布が条件付き共益分布ー>積は準共役分布:なんのことか、もう忘れている!
|
1 2 3 4 5 6 7 8 9 10 11 12 13 14 15 16 17 18 19 20 21 22 23 24 25 26 27 28 29 30 31 32 33 34 35 36 37 38 39 40 41 42 43 44 45 46 47 48 49 50 51 52 53 54 55 56 57 58 59 60 61 62 63 64 65 66 67 68 69 70 71 72 73 |
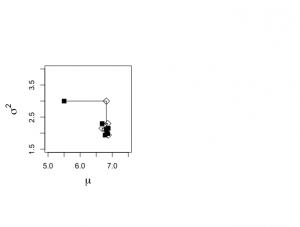
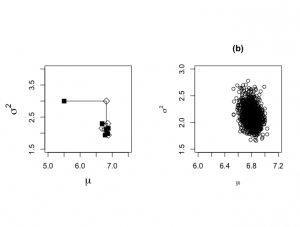
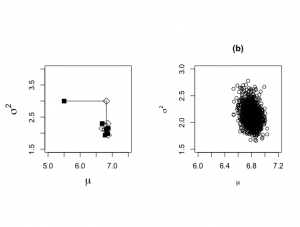
> # XXXXXXXXXXXXXXXXXXXXXXXXXXXXXXXXX > # Gibbs sampling of normal data set > # XXXXXXXXXXXXXXXXXXXXXXXXXXXXXXXXX > > start.x <- 5.5 > start.y <- 3 > > nchain <- 1500 > > theta.1 <- rep(0,nchain) > theta.2 <- rep(0,nchain) > > plot.1 <- rep(0,nchain*2) > plot.2 <- rep(0,nchain*2) > > # Create plot similar to Figure 6.1, but now the plot is not included in the book > > set.seed(727) > > ichain <- 1 > iplot <- 1 > theta.1[ichain] <- start.x > theta.2[ichain] <- start.y > > plot.1[iplot] <- start.x > plot.2[iplot] <- start.y > > par(mfrow=c(1,2)) > par(mar=c(5,5,4,2)+0.1) > par(pty="s") > > plot(start.x,start.y,xlab=expression(mu), + ylab=expression(sigma^{2}),type="n", + xlim=c(5,7.5),ylim=c(1.5,4),main="",cex.lab=1.5) > points(start.x,start.y,cex=1.4,pch=15) > > while (ichain < nchain) { + + sigma2.k <- theta.2[ichain] + pi1 <- sigma2.k /(sigma2.k + ntalp*sigma20) + mubar.k <- pi1*mu0+(1-pi1)*mtalp + sigma2bar.k <- (sigma20*sigma2.k)/(sigma2.k+ntalp*sigma20) + theta.1[ichain+1] <- rnorm(1,mubar.k,sqrt(sigma2bar.k)) + + iplot <- iplot+1 + plot.1[iplot] <- theta.1[ichain+1] + plot.2[iplot] <- theta.2[ichain] + + if (ichain <= 5){ + segments(plot.1[iplot-1],plot.2[iplot-1],plot.1[iplot],plot.2[iplot]) + points(plot.1[iplot],plot.2[iplot],cex=1.4,pch=5)} + + phi.u <- rchisq(1,nu0+ntalp) + theta.u <- 1/phi.u + sstalpmu <- (talp-theta.1[ichain+1])%*%(talp-theta.1[ichain+1])+nu0*tau20 + sigma2.u <- sstalpmu*theta.u + + theta.2[ichain+1] <- sigma2.u + + iplot <- iplot+1 + plot.1[iplot] <- theta.1[ichain+1] + plot.2[iplot] <- theta.2[ichain+1] + + if (ichain <= 5){ + segments(plot.1[iplot-1],plot.2[iplot-1],plot.1[iplot],plot.2[iplot]) + points(plot.1[iplot],plot.2[iplot],cex=1.4,pch=15)} + + ichain <- ichain +1 + + } > theta.1[1:5];theta.2[1:5] [1] 5.500000 6.816789 6.777433 6.874340 6.684448 [1] 3.000000 2.112996 1.939344 2.150613 2.299702 |
|
1 2 3 4 5 6 7 8 9 10 11 |
> nstart <- 501 > > burnin <- seq(1,nstart*2-3,2) > > nplot <- nchain*2-1 > isubplot <- seq(nstart*2-1,nplot,2) > > plot(plot.1[isubplot],plot.2[isubplot],xlab=expression(mu), + ylab=expression(sigma^{2}), + type="n",xlim=c(6,7.2),ylim=c(1.5,3),main="(b)") > points(plot.1[isubplot],plot.2[isubplot],cex=1,pch=1) |
|
1 2 3 4 5 6 7 8 9 10 11 12 13 14 15 |
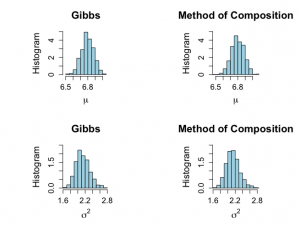
> # HISTOGRAMS after burn-in part > # Figure not in book > > mumin <- min(plot.1[isubplot],mu.2) > mumax <- max(plot.1[isubplot],mu.2) > > > par(mfrow=c(2,2)) > par(pty="s") > hist(plot.1[isubplot],xlab=expression(mu),ylab="Histogram",prob=T, + cex.lab=1.5,col="light blue",main="Gibbs",xlim=c(mumin,mumax),ylim=c(0,5), + cex.axis=1.3,cex.main=1.7) > hist(mu.2,xlab=expression(mu),ylab="Histogram",prob=T, + cex.lab=1.5,col="light blue",main="Method of Composition",xlim=c(mumin,mumax),ylim=c(0,5), + cex.axis=1.3,cex.main=1.7) |
|
1 2 3 4 5 6 7 8 9 10 11 12 |
> > sigma2min <- min(plot.2[isubplot],sigma2.2) > sigma2max <- max(plot.2[isubplot],sigma2.2) > > > hist(plot.2[isubplot],xlab=expression(sigma^{2}),ylab="Histogram",prob=T, + cex.lab=1.5,col="light blue",main="Gibbs",xlim=c(sigma2min,sigma2max), + ylim=c(0,2.5), cex.axis=1.3,cex.main=1.7) > hist(sigma2.2,xlab=expression(sigma^{2}),ylab="Histogram",prob=T, + cex.lab=1.5,col="light blue",main="Method of Composition",xlim=c(sigma2min,sigma2max), + ylim=c(0,2.5), cex.axis=1.3,cex.main=1.7) > |
|
1 2 3 4 5 6 7 8 9 10 11 12 13 |
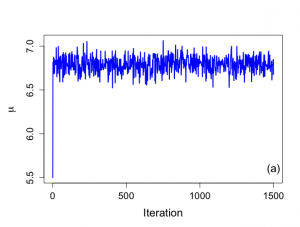
> # Trace plots -- figure 6.4 > > par(mar=c(5,5,4,2)) > > par(mfrow=c(1,1)) > par(pty="m") > > > plot(1:nchain,plot.1[1:nchain],xlab="Iteration", + ylab=expression(paste(mu)),type="n",cex.lab=1.5,cex=1.2,cex.axis=1.3, + main="",bty="o") > lines(1:nchain,plot.1[1:nchain],lwd=2,col="blue") > text(1500,5.6,"(a)",cex=1.5) |
|
1 2 3 4 5 |
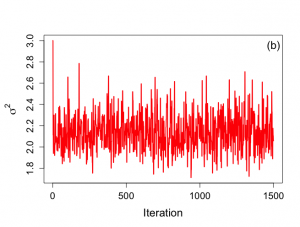
> plot(1:nchain,plot.2[1:nchain],xlab="Iteration", + ylab=expression(paste(sigma^{2})),type="n",cex.lab=1.5,cex=1.2,cex.axis=1.3, + main="",bty="o") > lines(1:nchain,plot.2[1:nchain],lwd=2,col="red") > text(1500,2.95,"(b)",cex=1.5) |
|
1 2 3 4 5 6 7 8 9 10 |
> summary(plot.1[isubplot]);summary(plot.2[isubplot]) Min. 1st Qu. Median Mean 3rd Qu. Max. 6.529 6.742 6.794 6.796 6.854 7.034 Min. 1st Qu. Median Mean 3rd Qu. Max. 1.658 2.003 2.115 2.133 2.248 2.779 > summary(mu.2);summary(sigma2.2) Min. 1st Qu. Median Mean 3rd Qu. Max. 6.482 6.740 6.797 6.799 6.860 7.067 Min. 1st Qu. Median Mean 3rd Qu. Max. 1.638 2.008 2.128 2.139 2.250 2.803 |

