Bayesian Biostatistics by E Lesaffre & AB Lawson, Chapter 6 学習ノート
ーーーーーーーーーーーーーーーーーーーーーーーーーーーーーーーーーーーーー
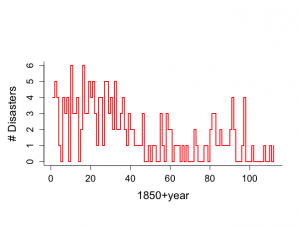
例IV.4: 英国単行災害データ:ギブス・サンプラーを用いた変化点の発見
1851年かん1962年までの英国の炭鉱での重大事故の数。
40年以後、災害の頻度が減少している可能性を統計学的に調査する。
kが変換点であるポアソン分布を仮定する。
変化点であるk年まで平均θで、その後、平均λのポアソン分布を想定する。
yi = Poison(θ), i=1,…..k
yi = Poison(λ), i=j+1,….,n
ここでn=112
θとλにたいして、条件付き共役事前分布を選択する:
θ~Gamma(a1, b1), λ~Gamma(a2, b2)
p(k) = 1/n
b1~Gamma(c1, d1), b2~Gamma(c2, d2)
c1, c2, d1, d2は固定。
|
1 2 3 4 5 6 7 8 9 10 11 12 13 14 15 16 17 18 19 20 21 22 23 24 25 26 27 28 29 30 |
> # British colamining disasters data > # Gibbs sampling analysis > # Example VI.4 > # Figure 6.5 is created and Figure 6.6 > # Many other figures are included, not reported in the book > > year <- c(1,2,3,4,5,6,7,8,9,10,11,12,13,14,15,16, + 17,18,19,20,21,22,23,24,25,26,27,28,29,30,31,32, + 33,34,35,36,37,38,39,40,41,42,43,44,45,46,47,48, + 49,50,51,52,53,54,55,56,57,58,59,60,61,62,63,64, + 65,66,67,68,69,70,71,72,73,74,75,76,77,78,79,80, + 81,82,83,84,85,86,87,88,89,90,91,92,93,94,95,96, + 97,98,99,100,101,102,103,104,105,106,107,108,109,110,111,112) > > count <- c(4,5,4,1,0,4,3,4,0,6,3,3,4,0,2,6,3,3,5,4,5,3,1,4,4,1,5,5,3,4,2,5,2,2, + 3,4,2,1,3,2,2,1,1,1,1,3,0,0,1,0,1,1,0,0,3,1,0,3,2,2,0,1,1,1,0,1,0,1,0,0,0,2,1,0,0,0,1, + 1,0,2,3,3,1,1,2,1,1,1,1,2,4,2,0,0,0,1,4,0,0,0,1,0,0,0,0,0,1,0,0,1,0,1) > > last <- 112 > t <- rep(1,last) > > par(mar=c(7,5,7,2)) > > par(mfrow=c(1,1)) > par(pty="m") > > > plot(year, count, xlab="1850+year",ylab="# Disasters", + type="n",bty="l",main="",cex.lab=1.5,cex=1.2,cex.axis=1.3) > lines(year, count,type="s",lwd=2,col="red") |
パラメータa,c,dの選択:Tannerによって仮定された値 a1=a21=0.5, c1=c2=0, d1=d2=1を用いる。
|
1 2 3 4 5 6 7 8 9 10 11 12 13 14 15 16 17 18 19 20 21 22 23 24 25 26 27 28 29 30 31 32 33 34 35 36 37 38 |
> # Gibbs sampling > > > a1 <- 0.5 > a2 <- 0.5 > c1 <- 0 > c2 <- 0 > d1 <- 1 > d2 <- 1 > > > start.theta <- 0.1 > start.lambda <- 0.1 > start.b1 <- 0.1 > start.b2 <- 0.1 > start.k <- 60 > > nchain <- 10000 > > theta <- rep(NA,nchain) > lambda <- rep(NA,nchain) > b1 <- rep(NA,nchain) > b2 <- rep(NA,nchain) > k <- rep(NA,nchain) > > Lk <- rep(NA,last) > pk <- rep(NA,last) > > > theta[1] <- start.theta > lambda[1] <- start.lambda > b1[1] <- start.b1 > b2[1] <- start.b2 > k[1] <- start.k > > ichain <- 1 > > set.seed(727) |
|
1 2 3 4 5 6 7 8 9 10 11 12 13 14 15 16 17 18 19 20 21 22 23 24 25 26 27 28 29 30 31 32 33 34 35 36 37 38 39 40 41 42 43 44 45 46 47 48 49 50 51 52 53 54 55 56 57 58 59 60 61 62 |
> # start the clock > > ptm <- proc.time() > > > while (ichain < nchain) { #マルコフ + + alpha <- a1+sum(count[1:k[ichain]]) + beta <- k[ichain]+b1[ichain] + theta[ichain+1] <- rgamma(1,alpha,rate=beta) #θの条件付き分布 + + alpha <- a2+sum(count[(k[ichain]+1):last]) + beta <- last-k[ichain]+b2[ichain] + lambda[ichain+1] <- rgamma(1,alpha,rate=beta) #λの条件付き分布 + + alpha <- a1+c1 + beta <- theta[ichain+1]+d1 + b1[ichain+1] <- rgamma(1,alpha,rate=beta) #b1の条件付き分布 + + alpha <- a2+c2 + beta <- lambda[ichain+1]+d2 + b2[ichain+1] <- rgamma(1,alpha,rate=beta) #b2の条件付き分布 + + ik <- 1 + for (ik in 1:last){ + lterm1 <- (lambda[ichain+1]-theta[ichain+1])*ik + lterm2 <- (sum(count[1:ik]))*(log(theta[ichain+1])-log(lambda[ichain+1])) + Lk[ik] <- exp(lterm1+lterm2) + } + Ldenom <- sum(Lk) + pk <- Lk/Ldenom + k[ichain+1] <- sample(year,size=1,prob=pk) #kの条件付き分布 + + ichain <- ichain + 1 + } > > > # Stop the clock > > proc.time() - ptm ユーザ システム 経過 2.147 0.462 2.644 > > nstart <- 501 > > burnin <- seq(1,nstart*2-3,2) > > # Histograms prior to convergence > > par(mar=c(4,5,4,2)) > > par(mfrow=c(2,2)) > par(pty="s") > hist(theta[burnin],xlab=expression(theta),ylab="Density", nclas=20,prob=T, + cex.lab=1.5,col="light blue",main="Burn-in part") > hist(lambda[burnin],xlab=expression(lambda),ylab="Density", nclas=20,prob=T, + cex.lab=1.5,col="light blue",main="Burn-in part") > hist(theta[burnin]/lambda[burnin],xlab=expression(theta/lambda),ylab="Density", + nclas=20,prob=T,cex.lab=1.5,col="light blue",main="Burn-in part") > hist(k[burnin],xlab="k",ylab="Density", nclas=113,prob=T, + cex.lab=1.5,col="light blue",main="Burn-in part") > |
|
1 2 3 4 5 6 7 8 9 10 11 12 13 14 15 16 17 18 19 20 21 22 23 24 25 26 27 28 29 30 31 32 33 |
> # HISTOGRAMS after burn-in part > > > par(mfrow=c(1,2)) > par(pty="s") > hist(theta[nstart:nchain],xlab=expression(theta), + ylab="", nclas=20,prob=T,main="",cex.lab=1.5,col="light blue", + cex.axis=1.3) > hist(lambda[nstart:nchain],xlab=expression(lambda), + ylab="", nclas=20,prob=T,main="",cex.lab=1.5,col="light blue", + cex.axis=1.3) > > par(mfrow=c(1,2)) > hist(theta[nstart:nchain]/lambda[nstart:nchain], + xlab=expression(theta/lambda), + ylab="", nclas=20,prob=T,,main="",cex.lab=1.5,col="light blue", + cex.axis=1.3) > hist(k[nstart:nchain],xlab="k",ylab="", + nclas=length(unique(k[nstart:nchain])), + prob=T,main="",cex.lab=1.5,col="light blue", + cex.axis=1.3) > > quantile(theta[nstart:nchain]/lambda[nstart:nchain],c(0.025,0.975)) 2.5% 97.5% 2.502344 4.562801 > > summary(theta[nstart:nchain]/lambda[nstart:nchain]) Min. 1st Qu. Median Mean 3rd Qu. Max. 1.807 3.038 3.382 3.418 3.749 5.896 > sqrt(var(theta[nstart:nchain]/lambda[nstart:nchain])) [1] 0.5294003 > > |
|
1 2 3 4 5 6 7 8 9 10 11 12 13 14 15 16 17 18 |
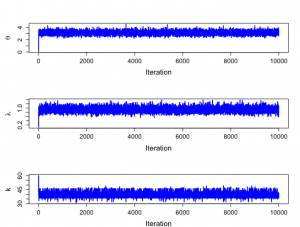
> #trace plots > > > par(mfrow=c(3,1)) > par(pty="m") > > plot(1:nchain,theta[1:nchain],xlab="Iteration",ylab=expression(theta),type="n", + cex.lab=1.5,cex.axis=1.3) > lines(1:nchain,theta[1:nchain],lwd=2,col="blue") > > plot(1:nchain,lambda[1:nchain],xlab="Iteration",ylab=expression(lambda),type="n", + cex.lab=1.5,cex.axis=1.3) > lines(1:nchain,lambda[1:nchain],lwd=2,col="blue") > > plot(1:nchain,k[1:nchain],xlab="Iteration",ylab="k",type="n", + cex.lab=1.5,cex.axis=1.3) > lines(1:nchain,k[1:nchain],lwd=2,col="blue") > |
|
1 2 3 4 5 6 7 8 9 10 11 12 13 14 15 16 17 |
> # Posterior information > > summary(theta[nstart:nchain]);summary(lambda[nstart:nchain]) Min. 1st Qu. Median Mean 3rd Qu. Max. 2.213 2.917 3.114 3.122 3.316 4.502 Min. 1st Qu. Median Mean 3rd Qu. Max. 0.55<a href="http://anesth-kpum.org/blog_ts/wp-content/uploads/2018/03/Rplot147.png"><img src="http://anesth-kpum.org/blog_ts/wp-content/uploads/2018/03/Rplot147-300x227.png" alt="" width="300" height="227" class="alignnone size-medium wp-image-1503" /></a>22 0.8461 0.9242 0.9276 1.0052 1.3820 > summary(k[nstart:nchain]);summary(b1[nstart:nchain]) Min. 1st Qu. Median Mean 3rd Qu. Max. 31.00 39.00 40.00 39.91 41.00 49.00 Min. 1st Qu. Median Mean 3rd Qu. Max. 0.00000 0.01247 0.05417 0.12113 0.16070 1.81680 > summary(b2[nstart:nchain]) Min. 1st Qu. Median Mean 3rd Qu. Max. 0.00000 0.02645 0.11523 0.25608 0.33803 4.02840 > > |
|
1 2 3 4 5 6 7 8 9 10 11 12 13 |
> > > par(mfrow=c(1,2)) > par(pty="s") > > plot(theta[nstart:nchain],lambda[nstart:nchain], xlab=expression(theta), + ylab=expression(lambda),type="n",cex.lab=1.5,cex.axis=1.3) > points(theta[nstart:nchain],lambda[nstart:nchain],col="red") > > plot(k[nstart:nchain],lambda[nstart:nchain], xlab="k", + ylab=expression(lambda),type="n",cex.lab=1.5) > points(k[nstart:nchain],lambda[nstart:nchain],col="red",cex.axis=1.3) > |
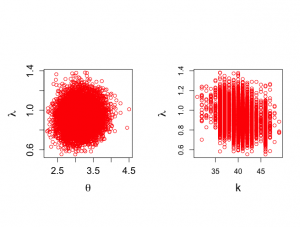
kの事後分布は、1891年頃に炭鉱災害が大幅に減少し、θ/λの平均は3.42で、事故が以前にはoyoso
3.5倍あったということを意味し、95%信頼区間が[2.48, 4.59]であることがわかる。
例VI.5:骨粗鬆症研究:ギブス・サンプラーによる事後分布の探索
234名の年配女性(平均年齢75)BMIと骨粗しょう症マーカーTBBMCの回帰分析
切片β0、傾きβ1、残差分散σ^2の3つのパラメータ
p(σ^2|β0, β1, y) = Inv-χ^2(n, s^2β)
p(β0|σ^2, β1, y) = N(rβ1, σ^2/n)
p(β1|σ^2, β0, y) = N(rβ0, σ^2/xT x)
|
1 2 3 4 5 6 7 8 9 10 11 12 13 14 15 |
> install.packages("mvtnorm") URL 'https://cran.rstudio.com/bin/macosx/el-capitan/contrib/3.4/mvtnorm_1.0-7.tgz' を試しています Content type 'application/x-gzip' length 222977 bytes (217 KB) ================================================== downloaded 217 KB The downloaded binary packages are in /var/folders/0j/j_y5y9pj73g9f1r01zqzycxm0000gp/T//Rtmp3Xbved/downloaded_packages > library("mvtnorm") > > attach(osteop) > objects(2) [1] "AGE" "BMI" "TBBMC" > |
|
1 2 3 4 5 6 7 8 9 10 11 12 13 14 15 16 17 18 19 20 21 22 23 24 25 26 27 28 29 30 31 32 33 34 35 36 37 38 39 40 41 42 43 44 45 46 47 48 49 50 51 52 53 54 55 56 57 58 59 60 61 62 63 64 65 66 67 68 69 |
> x <- bmi[!is.na(tbbmc)] > y <- tbbmc[!is.na(tbbmc)] > z <- age[!is.na(tbbmc)] > > # Classical linear regression analysis > > summary(x) Min. 1st Qu. Median Mean 3rd Qu. Max. 17.61 23.24 25.83 26.35 28.99 39.84 > summary(y) Min. 1st Qu. Median Mean 3rd Qu. Max. 0.579 1.661 1.847 1.877 2.071 2.837 > summary(lm(y ~x)) Call: lm(formula = y ~ x) Residuals: Min 1Q Median 3Q Max -1.17225 -0.18563 -0.00723 0.19234 0.91579 Coefficients: Estimate Std. Error t value Pr(>|t|) (Intercept) 0.812856 0.115034 7.066 1.85e-11 *** x 0.040390 0.004308 9.376 < 2e-16 *** --- Signif. codes: 0 ‘***’ 0.001 ‘**’ 0.01 ‘*’ 0.05 ‘.’ 0.1 ‘ ’ 1 Residual standard error: 0.2869 on 232 degrees of freedom Multiple R-squared: 0.2748, Adjusted R-squared: 0.2717 F-statistic: 87.91 on 1 and 232 DF, p-value: < 2.2e-16 > > attributes(summary(lm(y ~x))) $names [1] "call" "terms" "residuals" "coefficients" [5] "aliased" "sigma" "df" "r.squared" [9] "adj.r.squared" "fstatistic" "cov.unscaled" $class [1] "summary.lm" > attributes(lm(y ~x))$coefficients NULL > lm(y ~x)$coefficients (Intercept) x 0.81285570 0.04038977 > > summary(lm(y ~x))$coefficients Estimate Std. Error t value Pr(>|t|) (Intercept) 0.81285570 0.115033708 7.066239 1.846215e-11 x 0.04038977 0.004307706 9.376167 6.418537e-18 > # Table 6.1 + histograms not shown in ch 6 # Application of METHOD OF COMPOSITION mx <- mean(x) n <- length(x) my <- mean(y) s <- summary(lm(y ~x))$sigma s2 <- s^2 df <- n-2 ones <- rep(1,n) X <- matrix(cbind(ones,x),ncol=2) covpartial <- solve(t(X)%*%X) covmat <- s2*solve(t(X)%*%X) mbeta <- lm(y ~x)$coefficients mbeta |
|
1 2 3 4 5 6 7 8 9 10 11 12 13 14 15 16 17 18 19 20 21 22 23 24 25 26 27 28 29 30 31 32 33 34 35 36 37 38 39 40 41 42 43 44 45 46 47 48 49 50 51 52 53 54 55 56 57 58 59 60 61 62 63 64 65 66 67 68 69 70 71 72 73 74 75 76 77 78 79 80 |
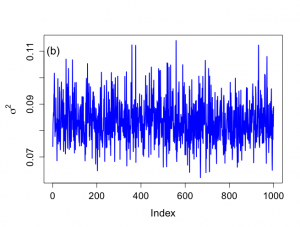
> # Start Method of Composition > # Sample from sigma then from beta given sigma (1000 times) > # Make use of theoretical results > > > set.seed(727) > > nsimul <- 1000 > > # Posterior distribution of sigma^2 > > phi.u <- rchisq(nsimul,n-2) > theta.u <- 1/phi.u > sigma2.u <- (n-2)*s2*theta.u > > # Posterior summary statistics > > meansamplesigma2 <- mean(sigma2.u) > sdsamplesigma2 <- sqrt(var(sigma2.u)) > unl.conf <- meansamplesigma2 -1.96*sdsamplesigma2/sqrt(nsimul) > upl.conf <- meansamplesigma2 +1.96*sdsamplesigma2/sqrt(nsimul) > meansamplesigma2;sdsamplesigma2;unl.conf;upl.conf [1] 0.08333061 [1] 0.008001992 [1] 0.08283465 [1] 0.08382658 > > quantile(sigma2.u, c(.025,0.25,0.50,0.75,.975)) 2.5% 25% 50% 75% 97.5% 0.06903948 0.07793073 0.08237375 0.08826791 0.10128008 > > # NOT IN GRAPH !!! > > #hist(sigma2.u,xlab="SIGMA^2",ylab="HISTOGRAM", nclas=30,prob=T) > > # Marginal posterior distribution of mu > # Obtained from conditional posterior distributon of mu given sigma^2 > # Then average over the sampled values of sigma^2 > > rbeta.u <- matrix(rep(NA,2*nsimul),ncol=2) > covpartial <- solve(t(X)%*%X) > > isimul <- 1 > for (isimul in 1:nsimul){ + rbeta.u[isimul,] <- rmvnorm(1,mean=mbeta,sigma=sigma2.u[isimul]*covpartial) + } > > # Posterior summary statistics > > meanbeta <- rep(NA,2) > sdbeta <- rep(NA,2) > unl.conf <- rep(NA,2) > upl.conf <- rep(NA,2) > > meanbeta[1] <- mean(rbeta.u[,1]) > meanbeta[2] <- mean(rbeta.u[,2]) > sdbeta[1] <- sqrt(var(rbeta.u[,1])) > sdbeta[2] <- sqrt(var(rbeta.u[,2])) > unl.conf[1] <- meanbeta[1] -1.96*sdbeta[1]/sqrt(nsimul) > upl.conf[1] <- meanbeta[1] +1.96*sdbeta[1]/sqrt(nsimul) > unl.conf[2] <- meanbeta[2] -1.96*sdbeta[2]/sqrt(nsimul) > upl.conf[2] <- meanbeta[2] +1.96*sdbeta[2]/sqrt(nsimul) > meanbeta [1] 0.80850686 0.04056134 > sdbeta [1] 0.115669780 0.004313623 > unl.conf[1];upl.conf[1] [1] 0.8013376 [1] 0.8156761 > unl.conf[2];upl.conf[2] [1] 0.04029398 [1] 0.0408287 > > quantile(rbeta.u[,1], c(.025,0.25,0.50,0.75,.975)) 2.5% 25% 50% 75% 97.5% 0.5728895 0.7369592 0.8094813 0.8839616 1.0329555 > quantile(rbeta.u[,2], c(.025,0.25,0.50,0.75,.975)) 2.5% 25% 50% 75% 97.5% 0.03215883 0.03778455 0.04060396 0.04324953 0.04943498 > |
|
1 2 3 4 5 6 7 8 9 10 11 |
> # Histograms not included in book > > par(mfrow=c(1,2)) > par(pty="s") > > hist(rbeta.u[,1],xlab=expression(beta[0]),ylab="Histogram",main="", + nclas=30,prob=T,cex.lab=1.5,col="light blue",cex.axis=1.3) > hist(rbeta.u[,2],xlab=expression(beta[1]),ylab="Histogram",main="", + nclas=30,prob=T,cex.lab=1.5,col="light blue",cex.axis=1.3) > > |
|
1 2 3 4 5 6 7 8 9 10 11 12 13 14 15 16 17 18 19 20 21 22 23 24 25 26 27 28 29 30 31 32 33 34 35 36 37 38 39 40 41 42 |
> # Histograms not included in book > > par(mfrow=c(1,2)) > par(pty="s") > > hist(rbeta.u[,1],xlab=expression(beta[0]),ylab="Histogram",main="", + nclas=30,prob=T,cex.lab=1.5,col="light blue",cex.axis=1.3) > hist(rbeta.u[,2],xlab=expression(beta[1]),ylab="Histogram",main="", + nclas=30,prob=T,cex.lab=1.5,col="light blue",cex.axis=1.3) > > > # Trace plots > > > par(mar=c(5,5,4,2)) > > par(mfrow=c(1,1)) > par(pty="m") > > > # First index plots obtained from Method of Composition > # For comparative purposes > > # Figure 6.7 > > plot(1:nsimul,rbeta.u[,2],xlab="Index",ylab=expression(paste(beta[1])), + type="n",main="",cex.lab=1.4,cex=1.2,cex.axis=1.3,bty="o") > lines(1:nsimul,rbeta.u[,2],lwd=2,col="blue") > text(3,0.054,"(a)",cex=1.5) > > minbeta<-min(rbeta.u[,2]) > maxbeta<-max(rbeta.u[,2]) > > plot(1:nsimul,sigma2.u,xlab="Index",ylab=expression(paste(sigma^{2})), + type="n",main="",cex.lab=1.4,cex=1.2,cex.axis=1.3,bty="o") > lines(1:nsimul,sigma2.u,lwd=2,col="blue") > text(3,0.11,"(b)",cex=1.5) > > minsigma2<-min(sigma2.u) > maxsigma2<-max(sigma2.u) > > |
|
1 2 3 4 5 6 7 8 9 10 11 12 13 14 15 16 17 18 19 20 21 22 23 24 25 26 27 28 29 30 31 32 33 34 35 36 37 38 39 40 41 42 43 44 45 46 47 48 49 50 51 52 53 54 55 56 57 58 59 60 61 62 63 64 65 66 67 68 69 70 71 72 73 74 75 76 77 78 |
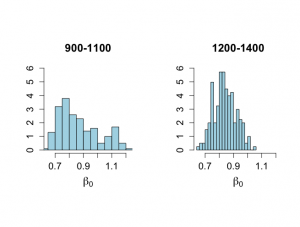
> # Gibbs analysis > # Figure 6.8 > > nsample <- length(x) > > start.beta0 <- 0.7 > start.beta1 <- 0.05 > start.sigma2 <- .1 > nchain <- 1500 > > beta0 <- rep(NA,nchain) > beta1 <- rep(NA,nchain) > sigma2 <- rep(NA,nchain) > logpos <- rep(NA,nchain) > > beta0[1] <- start.beta0 > beta1[1] <- start.beta1 > sigma2[1] <- start.sigma2 > logpos[1] <- -0.5*((nsample+2)*log(sigma2[1])+(y-beta0[1]-beta1[1]*x)%*%(y-beta0[1]-beta1[1]*x)/sigma2[1]) > > > ichain <- 1 > > set.seed(1727) > > while (ichain < nchain) { + + phi.u <- rchisq(1,nsample) + theta.u <- 1/phi.u + ss <- (y-beta0[ichain]-beta1[ichain]*x)%*%(y-beta0[ichain]-beta1[ichain]*x) + sigma2[ichain+1] <- ss*theta.u + + + ytilde.beta <- my-beta1[ichain]*mx + beta0[ichain+1] <- rnorm(1,ytilde.beta,sd=sqrt(sigma2[ichain+1]/nsample)) + + lengthx <- x%*%x + prodxy <- y%*%x + beta0.x <- beta0[ichain+1]*sum(x) + beta.alpha <- (prodxy-beta0.x)/lengthx + beta1[ichain+1] <- rnorm(1,beta.alpha,sd=sqrt(sigma2[ichain+1]/lengthx)) + + logpos[ichain+1] <- -0.5*((nsample+2)*log(sigma2[ichain+1])+ + (y-beta0[ichain+1]-beta1[ichain+1]*x)%*%(y-beta0[ichain+1]-beta1[ichain+1]*x)/sigma2[ichain+1]) + + ichain <- ichain+1 + } > > nstart <- 501 > > burnin <- 1:(nstart-1) > > # Histograms for parts of the chain > > par(mfrow=c(1,2)) > par(pty="s") > xmin <- min(beta0[900:1100],beta0[1200:1400]) > xmax <- max(beta0[900:1100],beta0[1200:1400]) > > # Beta_0 graphs not shown in Chapter 6 > > hist(beta0[900:1100],xlab=expression(beta[0]),ylab="", + nclas=20,prob=T,xlim=c(xmin,xmax), main="900-1100", + ylim=c(0,6),cex.lab=1.5,col="light blue",cex.main=1.5, + cex.axis=1.3) > > hist(beta0[1200:1400],xlab=expression(beta[0]),ylab="", + nclas=20,prob=T,xlim=c(xmin,xmax), main="1200-1400", + ylim=c(0,6),cex.lab=1.5,col="light blue",cex.main=1.5, + cex.axis=1.3) > > quantile(beta0[900:1100],c(.025,0.25,0.50,0.75,.975)) 2.5% 25% 50% 75% 97.5% 0.6703930 0.7536780 0.8327568 0.9576483 1.1724985 > quantile(beta0[1200:1400],c(.025,0.25,0.50,0.75,.975)) 2.5% 25% 50% 75% 97.5% 0.7059756 0.7879460 0.8335680 0.8939043 0.9960313 > |
|
1 2 3 4 5 6 7 8 9 10 11 12 13 14 15 16 17 18 19 20 21 22 |
> # Figure 6.9 > > xmin <- min(beta1[900:1100],beta1[1200:1400]) > xmax <- max(beta1[900:1100],beta1[1200:1400]) > > hist(beta1[900:1100],xlab=expression(beta[1]),ylab="", + nclas=20,prob=T,xlim=c(xmin,xmax), main="900-1100", + ylim=c(0,200),col="light blue",cex.lab=1.5,cex.main=1.5, + cex.axis=1.3) > > hist(beta1[1200:1400],xlab=expression(beta[1]),ylab="", + nclas=20,prob=T,xlim=c(xmin,xmax), main="1200-1400", + ylim=c(0,200),col="light blue",cex.lab=1.5,cex.main=1.5, + cex.axis=1.3) > > quantile(beta1[900:1100],c(.025,0.25,0.50,0.75,.975)) 2.5% 25% 50% 75% 97.5% 0.02747108 0.03464407 0.03971583 0.04247285 0.04539230 > quantile(beta1[1200:1400],c(.025,0.25,0.50,0.75,.975)) 2.5% 25% 50% 75% 97.5% 0.03359555 0.03692901 0.03951749 0.04166514 0.04438512 > |
|
1 2 3 4 5 6 7 8 9 10 11 12 13 14 15 16 17 18 19 20 21 22 23 24 25 |
> # Graph of sigma^2 not shown in ch 6 > > par(mfrow=c(1,2)) > par(pty="s") > xmin <- min(sigma2[900:1100],sigma2[1200:1400]) > xmax <- max(sigma2[900:1100],sigma2[1200:1400]) > > hist(sigma2[900:1100],xlab=expression(sigma^{2}),ylab="", + nclas=20,prob=T,xlim=c(xmin,xmax), main="900-1100", + ylim=c(0,60),col="light blue",cex.lab=1.5,cex.main=1.5, + cex.axis=1.3) > > hist(sigma2[1200:1400],xlab=expression(sigma^{2}),ylab="", + nclas=20,prob=T,xlim=c(xmin,xmax), main="1200-1400", + ylim=c(0,60),col="light blue",cex.lab=1.5,cex.main=1.5, + cex.axis=1.3) > > quantile(sigma2[900:1100],c(.025,0.25,0.50,0.75,.975)) 2.5% 25% 50% 75% 97.5% 0.07160133 0.07805319 0.08319168 0.08824954 0.09688587 > quantile(sigma2[1200:1400],c(.025,0.25,0.50,0.75,.975)) 2.5% 25% 50% 75% 97.5% 0.06731207 0.07693286 0.08208180 0.08676082 0.10159056 > > |
|
1 2 3 4 5 6 7 8 9 10 11 12 13 14 15 16 17 18 19 20 |
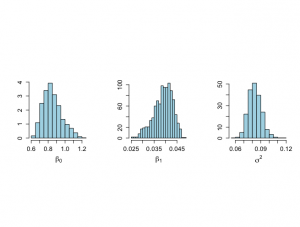
> # Histograms after burn-in part > # Graphs not shown in chapter 6 > > par(mfrow=c(1,3)) > par(pty="s") > hist(beta0[nstart:nchain],xlab=expression(beta[0]),ylab="", + nclas=20,prob=T,main="", + col="light blue",cex.lab=1.5,cex.main=1.5, + cex.axis=1.3) > hist(beta1[nstart:nchain],xlab=expression(beta[1]),ylab="", + nclas=20,prob=T,main="", + col="light blue",cex.lab=1.5,cex.main=1.5, + cex.axis=1.3) > hist(sigma2[nstart:nchain],xlab=expression(sigma^{2}),ylab="", + nclas=20,prob=T,main="", + col="light blue",cex.lab=1.5,cex.main=1.5, + cex.axis=1.3) > > > |
|
1 2 3 4 5 6 7 8 9 10 11 12 13 14 15 16 17 18 19 20 21 22 23 24 25 26 27 28 29 30 31 32 33 34 |
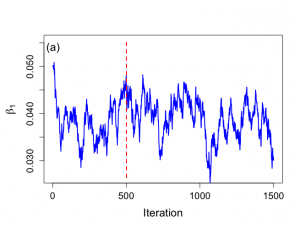
> # Trace plots > # Figure 6.8 > > par(mar=c(5,5,4,2)) > > par(mfrow=c(1,1)) > par(pty="m") > > nchain1 <- nchain > nchain2 <- nchain > > nstart <- 1 > > > plot(nstart:nchain1,beta1[nstart:nchain1],xlab="Iteration", + ylab=expression(paste(beta[1])), + ylim=c(minbeta,maxbeta), + type="n",main="",cex.lab=1.5,cex=1.2,cex.axis=1.3,bty="o") > lines(nstart:nchain1,beta1[nstart:nchain1],lwd=2,col="blue") > minbeta1 <- min(beta1[nstart:nchain1]) > maxbeta1 <- max(beta1[nstart:nchain1]) > segments(501,minbeta,501,maxbeta,lty="dashed",col="red",lwd=2) > text(3,0.054,"(a)",cex=1.5) > > > plot(nstart:nchain2,sigma2[nstart:nchain2],xlab="Iteration", + ylab=expression(paste(sigma^{2})), + type="n",main="",cex.lab=1.5,cex=1.2,cex.axis=1.3,bty="o") > lines(nstart:nchain2,sigma2[nstart:nchain2],lwd=2,col="blue") > minsigma2 <- min(sigma2[nstart:nchain1]) > maxsigma2 <- max(sigma2[nstart:nchain1]) > segments(501,minsigma2,501,maxsigma2,lty="dashed",col="red",lwd=2) > text(3,0.113,"(b)",cex=1.5) > |
6.2.5 スライス・サンプラー
|
1 2 3 4 5 6 7 8 9 10 11 12 13 14 15 16 17 18 19 20 21 22 23 24 25 26 27 28 29 30 31 32 33 34 35 36 37 38 39 40 41 42 43 44 45 46 47 48 49 50 |
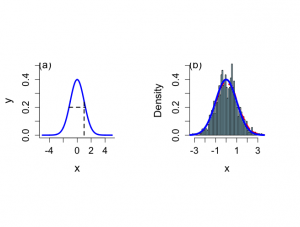
> # Illustration of slice sampler > # The slices > > par(mar=c(5,4,4,2)+0.1) > x <- seq(-5,5,0.01) > > par(mfrow=c(1,2)) > par(pty="s") > par(mar=c(5,4.5,2,4)) > > plot(x,dnorm(x,0,1),type="n",ylab="y",xlab="x", + cex.lab=1.5,cex=1.2,cex.axis=1.3,bty="l",ylim=c(0,0.5)) > lines(x,dnorm(x,0,1),type="l",lwd=3,col="blue") > segments(x[3*round(length(x)/5)],0, + x[3*round(length(x)/5)],dnorm(x[3*round(length(x)/5)],0,1),lwd=2,lty=2) > segments(-sqrt(-2*log(0.2*sqrt(2*pi))),0.2,sqrt(-2*log(0.2*sqrt(2*pi))), + 0.2,lwd=2,lty=2) > text(-4.6,0.5,"(a)",cex=1.4) > > # ONE GIBBS SAMPLE > > set.seed(113) > > niter <- 1000 > xval <- rep(0,niter) > yval <- rep(0,niter) > > yval[1] <- runif(1,0,1) > xval[1] <- runif(1,0,1) > > iter <- 2 > for (iter in 2:niter){ + yval[iter] <- runif(1,0, exp(-0.5*xval[iter-1]**2) ) + xval[iter] <- runif(1,-sqrt(-2*log(yval[iter])),sqrt(-2*log(yval[iter]))) + } > > > > start <- 101 > > xplot <- xval[start:niter] > > iqd <- summary(xplot)[5]- summary(xplot)[2] > > hist(xplot,xlab="x",nclas=50,prob=T,main="",ylim=c(0,0.5), + cex.lab=1.4,cex=1.2,cex.axis=1.3,,col="light blue") > lines(density(xplot,width=iqd),lty=2,lwd=3,col="red") > lines(x,dnorm(x,0,1),type="l",lwd=4,col="blue") > text(-2.9,0.5,"(b)",cex=1.4) > |
