Bayesian Biostatistics by E Lesaffre & AB Lawson, Chapter 6 学習ノート
ーーーーーーーーーーーーーーーーーーーーーーーーーーーーーーーーーーーーー
6.2 ギブス・サンプラー
6.2.1 2変量ギブス・サンプラー
例V.I血清アルカリフォスファターゼ研究:ギブス・サンプリングによる事後分布ー無情報事前分布ー
250名の健常人の血清アルカリフォスファターゼの測定にもとづく正規尤度の事後分布からサンプリングを行う。
ふたつの条件付き分布p(μ|σ^2,y)とp(σ^2|μ,y)を設定する。
N((μ|y_bar, σ^2/n)
pp(σ^2|μ,y)は、Inv-χ^2(σ^2|n,s_μ^2)分布である。ただしs_μ^2 = 1/nΣ(yi-μ)^2
ギブス・サンプラー
1.N((μ|y_bar, (σ^2)k/n)からμ(k+1)をサンプリングする。
2. Inv-χ^2(σ^2|n,s_μ(k+1)^2)から(σ^2)(k+1)をサンプリングする。
|
1 2 3 4 5 6 7 8 9 10 11 12 13 14 15 16 17 18 19 20 21 22 23 24 25 26 27 28 29 30 31 32 33 34 35 36 37 38 39 40 41 42 43 44 45 46 47 48 49 50 51 52 53 54 55 56 57 58 59 60 61 62 63 64 65 66 67 68 69 70 71 72 73 74 75 76 77 78 79 80 81 82 83 84 85 86 87 88 |
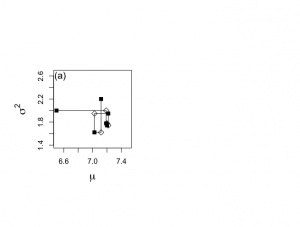
> # GIBBS SAMPLING with NONINFORMATIVE PRIOR > > attach(ALP) > > objects(2) [1] "alkfos" "artikel" > > alp <- alkfos[artikel==0] > talp <- 100*alp^(-1/2) > > mtalp <- mean(talp) > vartalp <- var(talp) > sdtalp <- sqrt(var(talp)) > ntalp <- length(talp) > > ntalp;mtalp;sdtalp;vartalp [1] 250 [1] 7.108724 [1] 1.365344 [1] 1.864165 > # Gibbs sampling of normal data set > # Generate a chain of size 1500 > > start.x <- 6.5 #パラメータベクトル(μ, σ^2)の初期値 > start.y <- 2 > > nchain <- 1500 > > theta.1 <- rep(0,nchain) > theta.2 <- rep(0,nchain) > > plot.1 <- rep(0,nchain*2) > plot.2 <- rep(0,nchain*2) > > # Plot the first 5 elements of the chain in the (mu, sigma^2)-plane > # Figure 6-1(a) > > par(mfrow=c(1,2)) > par(pty="s") > par(mar = c(5,6,4,2)+0.1) > > set.seed(7933) > > ichain <- 1 > iplot <- 1 > theta.1[ichain] <- start.x > theta.2[ichain] <- start.y > > plot.1[iplot] <- start.x > plot.2[iplot] <- start.y > > > plot(start.x,start.y,xlab=expression(mu), + ylab=expression(sigma^{2}),type="n",bty="o", + xlim=c(6.5,7.5),ylim=c(1.4,2.65),main="",cex.lab=1.5) > points(start.x,start.y,cex=1.2,pch=15) > text(6.55,2.6,"(a)",cex=1.3) > > while (ichain < nchain) { + theta.1[ichain+1] <- rnorm(1,mtalp,sqrt(theta.2[ichain]/ntalp)) #正規分布(標本平均, √σ/標本数)からのサンプリングしてθ1へ挿入 + + iplot <- iplot+1 + plot.1[iplot] <- theta.1[ichain+1] + plot.2[iplot] <- theta.2[ichain] + + if (ichain <= 5){ #ichainをカウンタにして5回繰り返す + segments(plot.1[iplot-1],plot.2[iplot-1],plot.1[iplot],plot.2[iplot]) + points(plot.1[iplot],plot.2[iplot],cex=1.2,pch=5)} #pch=5白菱:中間段階 + + phi.u <- rchisq(1,ntalp) #カイ二乗分布からのサンプリング + theta.u <- 1/phi.u #上記カイ二乗分布からのサンプリングの逆数 + sstalpmu <- (talp-theta.1[ichain+1])%*%(talp-theta.1[ichain+1]) #(スケール化alp-μ)^2 #%*%は行列積: + sigma2.u <- sstalpmu*theta.u #スケール化逆χ二乗分布 + + theta.2[ichain+1] <- sigma2.u #σ^2をθ2へ挿入 + + iplot <- iplot+1 + plot.1[iplot] <- theta.1[ichain+1] + plot.2[iplot] <- theta.2[ichain+1] + + if (ichain <= 5){ #ichainをカウンタにして5回繰り返す + segments(plot.1[iplot-1],plot.2[iplot-1],plot.1[iplot],plot.2[iplot]) + points(plot.1[iplot],plot.2[iplot],cex=1.2,pch=15)} #pch=15黒四角:ギブス連鎖の要素 + + ichain <- ichain +1 + + } > |
|
1 2 3 4 5 6 7 8 9 10 11 12 13 14 15 16 17 18 19 20 21 22 |
> # Report the first five generated values > > theta.1[1:5];theta.2[1:5] [1] 6.500000 7.187895 7.200420 7.217236 7.025612 [1] 2.000000 1.777938 1.741963 1.948193 1.621850 > > > # Plot the last 1000 generated values > # Figure 6-1(b) > > nstart <- 501 > > burnin <- seq(1,nstart*2-3,2) > > nplot <- nchain*2-1 > isubplot <- seq(nstart*2-1,nplot,2) > > plot(plot.1[isubplot],plot.2[isubplot],xlab=expression(mu), + ylab=expression(sigma^{2}),type="n",bty="o", + xlim=c(6.5,7.5),ylim=c(1.4,2.65),main="",cex.lab=1.5) > points(plot.1[isubplot],plot.2[isubplot],cex=0.7,pch=1) > text(6.55,2.6,"(b)",cex=1.3) |
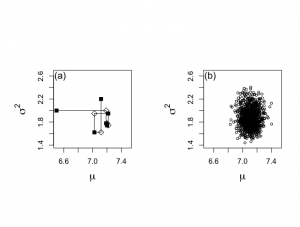
ギブス・サンプリングの全部の長さが1500個の連鎖で、最後の1000個のパラメータベクトル(μ, σ^2)

参考までにburin要素は、2毎に増加。
|
1 2 3 4 5 6 7 8 9 10 11 12 13 14 15 16 17 18 19 20 21 22 23 24 25 26 27 28 29 |
> burnin [1] 1 3 5 7 9 11 13 15 17 19 21 23 25 27 29 31 33 35 [19] 37 39 41 43 45 47 49 51 53 55 57 59 61 63 65 67 69 71 [37] 73 75 77 79 81 83 85 87 89 91 93 95 97 99 101 103 105 107 [55] 109 111 113 115 117 119 121 123 125 127 129 131 133 135 137 139 141 143 [73] 145 147 149 151 153 155 157 159 161 163 165 167 169 171 173 175 177 179 [91] 181 183 185 187 189 191 193 195 197 199 201 203 205 207 209 211 213 215 [109] 217 219 221 223 225 227 229 231 233 235 237 239 241 243 245 247 249 251 [127] 253 255 257 259 261 263 265 267 269 271 273 275 277 279 281 283 285 287 [145] 289 291 293 295 297 299 301 303 305 307 309 311 313 315 317 319 321 323 [163] 325 327 329 331 333 335 337 339 341 343 345 347 349 351 353 355 357 359 [181] 361 363 365 367 369 371 373 375 377 379 381 383 385 387 389 391 393 395 [199] 397 399 401 403 405 407 409 411 413 415 417 419 421 423 425 427 429 431 [217] 433 435 437 439 441 443 445 447 449 451 453 455 457 459 461 463 465 467 [235] 469 471 473 475 477 479 481 483 485 487 489 491 493 495 497 499 501 503 [253] 505 507 509 511 513 515 517 519 521 523 525 527 529 531 533 535 537 539 [271] 541 543 545 547 549 551 553 555 557 559 561 563 565 567 569 571 573 575 [289] 577 579 581 583 585 587 589 591 593 595 597 599 601 603 605 607 609 611 [307] 613 615 617 619 621 623 625 627 629 631 633 635 637 639 641 643 645 647 [325] 649 651 653 655 657 659 661 663 665 667 669 671 673 675 677 679 681 683 [343] 685 687 689 691 693 695 697 699 701 703 705 707 709 711 713 715 717 719 [361] 721 723 725 727 729 731 733 735 737 739 741 743 745 747 749 751 753 755 [379] 757 759 761 763 765 767 769 771 773 775 777 779 781 783 785 787 789 791 [397] 793 795 797 799 801 803 805 807 809 811 813 815 817 819 821 823 825 827 [415] 829 831 833 835 837 839 841 843 845 847 849 851 853 855 857 859 861 863 [433] 865 867 869 871 873 875 877 879 881 883 885 887 889 891 893 895 897 899 [451] 901 903 905 907 909 911 913 915 917 919 921 923 925 927 929 931 933 935 [469] 937 939 941 943 945 947 949 951 953 955 957 959 961 963 965 967 969 971 [487] 973 975 977 979 981 983 985 987 989 991 993 995 997 999 |
|
1 2 3 4 5 6 7 8 9 10 11 12 13 14 15 16 17 18 19 20 21 22 23 24 25 26 27 28 29 30 31 32 33 34 35 36 37 |
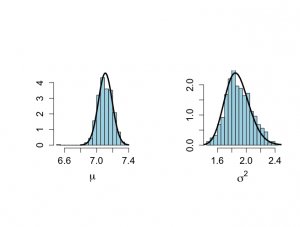
> # True distributions > # To compare with the sampled histograms > > unl.mu <- 6.8 > upl.mu <- 7.4 > > unl.sigma2 <- 1.2 > upl.sigma2 <- 2.5 > > > nmu <- 50 > nsigma2 <- 50 > ntilde <- 50 > > mu <- seq(unl.mu,upl.mu,length=nmu) > mus <- (mu-mtalp)/(sdtalp/sqrt(ntalp)) > pmu <- dt(mus,ntalp-1)*sqrt(ntalp)/sdtalp > sigma2 <- seq(unl.sigma2,upl.sigma2,length=nsigma2) > sigma2s <- (ntalp-1)*vartalp/sigma2 > psigma2 <- dchisq(sigma2s,ntalp-1)*(ntalp-1)*vartalp/(sigma2^2) > > > # Estimates of marginal posterior distributions based on Gibbs sampler > # Prior to convergence, figure not included in the book > > par(mfrow=c(1,2)) > par(pty="s") > hist(plot.1[burnin],xlab=expression(mu),ylim=c(0,max(pmu)), + ylab="",main="", nclas=30,prob=T,cex.lab=1.5,col="light blue", + cex.axis=1.3) > lines(mu,pmu,lwd=3,lty=1) > > hist(plot.2[burnin],xlab=expression(sigma^{2}),ylim=c(0,max(psigma2)), + ylab="", nclas=30,prob=T,main="",cex.lab=1.5,col="light blue", + cex.axis=1.3) > lines(sigma2,psigma2,lwd=3,lty=1) > |
|
1 2 3 4 5 6 7 8 9 10 11 12 13 14 |
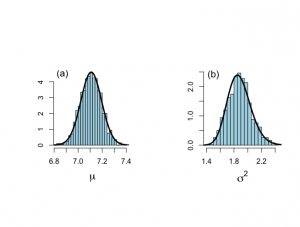
> # After burn-in part > # Figure 6.2 > > par(mfrow=c(1,2)) > par(pty="s") > hist(plot.1[isubplot],xlab=expression(paste(mu)),ylab="", + nclas=30,prob=T,main="",cex.lab=1.5,col="light blue") > lines(mu,pmu,lwd=3,lty=1) > text(6.87,4.5,"(a)",cex=1.3) > > hist(plot.2[isubplot],xlab=expression(paste(sigma^{2})),ylab="", + nclas=30,prob=T,main="",cex.lab=1.5,col="light blue") > lines(sigma2,psigma2,lwd=3,lty=1) > text(1.5,2.4,"(b)",cex=1.3) |


