Bayesian Biostatistics by E Lesaffre & AB Lawson, Chapter 2 学習ノート
———————————————————————
ベイズ流アプローチ:IBBENS調査から得られる事前分布
1. IBBENS調査からの事前分布の特定
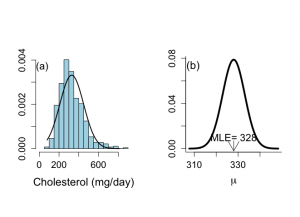
563名の被験者の食事性コレステロール値cholの標本平均は328 mg/dayで、標本標準偏差は120.3 mg/dayである。確率変数yが平均μ、標準偏差σの正規分布に従うとすると、その確率密度関数は、
1/√(2π)*σ * exp(1-(y-μ)^2 / 2σ^2): y~N(μ, σ^2)、またはN(y|μ,σ^2)
データが含まれているdeit.txtファイルを著者のサポートサイト
https://www.wiley.com/en-jp/Bayesian+Biostatistics-p-9780470018231
からダウンロードして、RStudioのデフォルトフォルダにおく。
データは、タブで仕切られたで0たファイルで、一行目はフィールド名なので、
delim()関数で、header=TRUE指定でdietに読み込んで、attach()する。
|
1 2 3 4 5 6 7 8 9 10 11 12 13 14 15 16 17 18 19 20 21 |
diet =read.delim("diet.txt", header=TRUE) attach(diet) par(mfrow=c(1,2)) par(pty="s") chol <- CHOL[!is.na(CHOL)] hist(chol,nclas=15,prob=T,xlab="Cholesterol (mg/day)",ylab="", xlim=c(0,900),main="",col="light blue",cex.lab=1.5,cex=1.2,cex.axis=1.3) text(30,0.0037,"(a)",cex=1.4) mchol <- mean(chol) sdchol <- sqrt(var(chol)) x <- seq (-5,4,0.01) x <- x*sdchol+mchol dx <- dnorm(x,mean=mchol,sd=sdchol) lines(x[x >= min(chol)],dx[x >= min(chol)],lwd=2) |
|
1 2 3 4 5 6 7 8 9 10 11 12 13 14 15 |
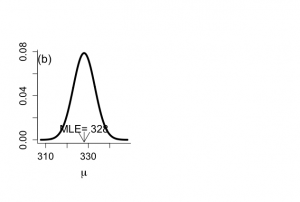
n <- 563 cholmean <- 328 cholSD <- 120.3 cholSEM <- cholSD/sqrt(n) x <- seq(cholmean-4*cholSEM,cholmean+4*cholSEM,0.01*cholSEM) lik <- (1/(sqrt(2*pi)*cholSEM))*exp(-0.5*(x-cholmean)**2/cholSEM**2) plot(x,lik,xlab=expression(mu),ylab="",type="n",bty="l",main=" ", cex.lab=1.5,cex=1.2,cex.axis=1.3) text(309.5,0.073,"(b)",cex=1.5) lines(x,lik,lwd=4) text(328,0.010,"MLE= 328",cex=1.4) arrows(328,0.007,328,-0.002) |
互いに独立である同一分布である正規確率変数の標本y={y1,…..,yn)に対する同時尤度は、
L(μ|y) = 1/(2π)^(n/2)*σ^2 * exp[-1/2σ^2 * Σ(yi-μ)^2]
y_mean を標本平均とし。Σ(yi-μ)^2 = Σ(yi-y_mean)^2 + Σ(y_mean – μ)^2であるため
L(μ|y) ∝ L(μ|y_mean) ∝ exp[-1/2 * (μ-y_mean/σ/√n)^2]: 平均y_mean、分散σ^2/nの正規分布のカーネル。
IBBENS調査を事前分布とするため、
尤度は N(μ|μ0, σ0^2)、ただしμ0=y_mean、σ0=σ/√n0 = 120.3/√563 = 5.072である。
IBBENS調査の事前分布は、
p(μ) = 1/√(2π)*σ0 * exp[-1/2 * ((μ-μ0)/σ0)^2]、ただしμ0=y0_mean、
2. 事後分布の構築
IBBENS-2調査がn=50 で計画され、コレステロール摂取量は318 mg/day、標準偏差は119.5 mg/day、95% CI = [284.3, 351.9] mg/dayであった。
IBBENS-2調査の尤度はL(μ|y_mean)である。
事後分布は、
p(μ|y) ∝ p(μ|y_mean) ∝ exp[-1/2[(μ-μ0/σ0)^2 + (μ-y_mean/(σ/√n))^2]]
μにたいする事後分布は、正規分布p(μ|y) = N(μ|μ_bar, σ_bar^2)
ただし、
μ_bar = (1/σ0^2*μ0 + n/σ^2*y_mean) / (1/σ0^2 + n/σ^2)
σ_bar^2 = 1 / (1/σ0^2 + n/σ^2)
正規事後分布は平均μ_bar = 327.2、と標準偏差σ_bar = 4.79 となる。
事前分布は、563名の被験者の食事性コレステロール値cholの標本平均は328 mg/dayで、標本標準偏差は120.3 mg/day
尤度は、n=50 で計画され、コレステロール摂取量は318 mg/day、標準偏差は119.5 mg/day、95% CI = [284.3, 351.9] mg/dayであった。
|
1 2 3 4 5 6 7 8 9 10 11 12 13 14 15 16 17 18 19 20 21 22 23 24 25 26 27 28 29 30 31 32 33 34 35 36 37 38 39 40 41 42 43 44 45 46 47 48 49 50 51 52 53 54 55 56 57 58 59 |
#normal function to calculate the posterior distribution posternorm <- function(mumin=250,mumax=400, priormu=328,priorvar=25, giventitle="") { mu <- seq(mumin,mumax,(mumax-mumin)/200) #combination of normal prior with normal likelihood chol <- c(274.8501,208.6479,286.7656,413.5640,344.2833,292.2896,296.8147, 198.4725, 466.3404, 422.0513, 158.3340, 252.9971, 316.3647, 237.2512, 381.1431, 131.5190, 300.1888, 341.7261, 487.6174, 200.7114, 216.6859, 466.1822, 455.6942, 449.0033, 290.7924, 275.1898, 292.9542, 328.8997, 99.7303, 275.1126, 366.7504, 272.8722, 436.3839, 160.2993, 269.5784, 394.8876, 234.3379, 449.0895, 153.6546, 301.6407, 376.8302, 381.5326, 378.2189, 607.6112, 162.4040, 251.7461, 274.9384, 272.1369, 712.3612, 283.9782) samplemu <- mean(chol) samplevar <- var(chol)/length(chol) weight0 <- 1/priorvar weight1 <- 1/samplevar postvar <- 1/(weight0+weight1) weight0 <- weight0*postvar weight1 <- weight1*postvar postmu <- weight0*priormu+weight1*samplemu ymax <-max(dnorm(mu,postmu,sqrt(postvar))) plot(mu,dnorm(mu,priormu,sqrt(priorvar)), xlab=expression(mu),ylab="",type="n",ylim=c(0,ymax*1.05), main=giventitle,bty="l",cex.lab=1.8,cex=1.2,cex.axis=1.3) lines(mu,dnorm(mu,priormu,sqrt(priorvar)),lwd=3,lty="dotted") text(locator(1),"IBBENS prior",adj=0,cex=1.3) lines(mu,dnorm(mu,samplemu,sqrt(samplevar)),lwd=3,lty="dashed") text(locator(1),"IBBENS-2 likelihood",adj=0,cex=1.3) lines(mu,dnorm(mu,postmu,sqrt(postvar)),lwd=3) text(locator(1),"IBBENS-2 posterior",adj=1,cex=1.3) print ("postmu=");print(postmu) print ("postvar=");print(postvar) } par (mfrow=c(1,1)) par(pty="m") posternorm(mumin=250,mumax=400, priormu=328,priorvar=25) [1] "postmu=" [1] 327.2006 [1] "postvar=" [1] 22.98758 |
3. 事後分布の性質
事後分布は、事前分布と尤度関数の中間とみなすことができて、両者の妥協compromiseである。
事後平均μ_barは、事前平均と標本平均の重み付き平均となる。
μ_bar = w0 * μ0 /(w0 + w1) + w1 * y_bar /(w0 + w1)、
ただし w0 = 1/σ0^2、w1 = 1/(σ^2/n)
事前分布は、563名の被験者の食事性コレステロール値cholの標本平均は328 mg/dayで、標本標準偏差は120.3 mg/day
尤度は、n=50 で計画され、コレステロール摂取量は318 mg/day、標準偏差は119.5 mg/day、95% CI = [284.3, 351.9] mg/dayであった。
注意:プログラム計算には事前分散σ0^2=25となっている。「4.事前情報と追加データの同等性」の観点から、事前分布の分散σ0^2がデータの分散σ^2と等しいと仮定するばあい、
σ0^2 = σ^2/n0 = 119.5^2 / 563 = 25.4 ≒ 25
ベイズ統計では分散の代わりに通常、分散の逆数=精度(precision)を使う。
重みw0は、事前精度(prior precision)、重みw1は標本精度(sample precision)と呼ばれる。
事後精度posterior precisionは、事前精度と事後精度の和となる。
1/σ^2 = w0 + w1
これは事後分布が事前分布より尖っていることを意味する。事後分布が事前分布や尤度関数よりもμに関して多い情報を含んでいることを意味する。
nが大きい時には、明らかにp(μ|y)≒N(μ|y_bar, σ^2/n)となる。標本サイズが増加する時、尤度が事前分布を支配することを示す。ヒョウンサイズが固定され、σ0->∞のとき、同じ結果が得られる。
事後分布は事前分布と同じ方の正規分布となる。つまりここでも共役性が成り立つ。
μの事後推定値は、併合調査(IBBENS調査とIBBENS-2調査を合わせたもの)の最尤推定値である。これは2つの調査の実施条件が同じであるという仮定を反映している。
注意点は、ベイズ統計の文献では、WinBUGSを含めて、正規分布N(μ, σ^2)は、N(μ, 1/σ^2)と表記される(本書では伝統的な前者を採用)。
|
1 2 3 4 5 6 7 8 9 10 11 12 13 14 15 16 17 18 19 20 21 22 23 24 25 26 27 28 29 30 31 32 33 34 35 36 37 38 39 40 41 42 43 44 45 46 47 48 49 50 51 52 53 54 55 56 57 58 59 60 61 62 63 64 65 66 67 68 69 |
> #normal function to calculate the posterior distribution > > posternorm <- function(mumin=250,mumax=400, priormu=328,priorvar=25, + giventitle="") + + + { + + mu <- seq(mumin,mumax,(mumax-mumin)/200) + + #combination of normal prior with normal likelihood + + + chol <- c(274.8501,208.6479,286.7656,413.5640,344.2833,292.2896,296.8147, + 198.4725, 466.3404, 422.0513, 158.3340, 252.9971, 316.3647, 237.2512, + 381.1431, 131.5190, 300.1888, 341.7261, 487.6174, 200.7114, 216.6859, + 466.1822, 455.6942, 449.0033, 290.7924, 275.1898, 292.9542, 328.8997, + 99.7303, 275.1126, 366.7504, 272.8722, 436.3839, 160.2993, 269.5784, + 394.8876, 234.3379, 449.0895, 153.6546, 301.6407, 376.8302, 381.5326, + 378.2189, 607.6112, 162.4040, 251.7461, 274.9384, 272.1369, 712.3612, + 283.9782) + + + samplemu <- mean(chol) + samplevar <- var(chol)/length(chol) + + weight0 <- 1/priorvar + weight1 <- 1/samplevar + postvar <- 1/(weight0+weight1) + weight0 <- weight0*postvar + weight1 <- weight1*postvar + postmu <- weight0*priormu+weight1*samplemu + + ymax <-max(dnorm(mu,postmu,sqrt(postvar))) + + + plot(mu,dnorm(mu,priormu,sqrt(priorvar)), + xlab=expression(mu),ylab="",type="n",ylim=c(0,ymax*1.05), + main=giventitle,bty="l",cex.lab=1.8,cex=1.2,cex.axis=1.3) + lines(mu,dnorm(mu,priormu,sqrt(priorvar)),lwd=3,lty="dotted") + text(locator(1),"Prior",adj=0,cex=1.4) + + lines(mu,dnorm(mu,samplemu,sqrt(samplevar)),lwd=3,lty="dashed") + text(locator(1),"Likelihood",adj=1,cex=1.4) + + lines(mu,dnorm(mu,postmu,sqrt(postvar)),lwd=3) + text(locator(1),"Posterior",adj=1,cex=1.4) + + print ("postmu=");print(postmu) + print ("postvar=");print(postvar) + + } > > par(mfrow=c(1,2)) > par(pty="s") > posternorm(mumin=250,mumax=400, priormu=328,priorvar=100, + giventitle="") [1] "postmu=" [1] 325.4242 [1] "postvar=" [1] 74.06447 > text(255,0.048,"(a)",cex=1.4) > > posternorm(mumin=250,mumax=400, priormu=340,priorvar=100, + giventitle="") [1] "postmu=" [1] 334.312 [1] "postvar=" [1] 74.06447 |
4. 事前情報と追加データの同等性
事前分布の分散σ0^2が、データの分散σ^2と等しいと仮定する場合、事後の分布の分散はσ_bar^2=σ^2/(n+1)となり、事前分布は1個の観測値を標本に追加することに対応。
μ_bar = n0 * μ0 / (n0 + n) + n * y_bar / (n0 + n)
σ_bar^2 = σ^2 /(n0 + n)
事前分布は、563名の被験者の食事性コレステロール値cholの標本平均は328 mg/dayで、標本標準偏差は120.3 mg/day
尤度は、n=50 で計画され、コレステロール摂取量は318 mg/day、標準偏差は119.5 mg/day、95% CI = [284.3, 351.9] mg/dayであった。
σ0^2 = σ^2/n0 = 119.5^2 / 563 = 25.4 ≒ 25
μ_bar = n0 * μ0 / (n0 + n) + n * y_bar / (n0 + n)
= 563 * 328 / 613 + 50 * 318 / 613 = 301.25 + 25.94 = 327.2
σ_bar^2 = σ^2 /(n0 + n) = 23.3 σ = 4.8
<ベイズ流アプローチ:主観事前分布>
事前分布のσ0^2を25から100へ増加させると、事前分布の影響が減少し、割り引かれたdiscounted状態となる。
事前平均をやや多めのμ0=340 mg/dayというように少し、事前の信念(知識)で修正して反映させることも可能。
<ベイズ流アプローチ:利用できる事前情報が無い場合>
σ0^2 -> ∞ とするとき、事後分布は、
N(μ|y_bar, σ^2/n)となり、事前情報と得率と見ることができる。
つまり、正規分布の場合、無情報事前分布は、大きな分散をもつことにある。平均値328で分散10000の正規事前分布と尤度との結合を示すと、
|
1 2 3 4 5 6 7 8 9 10 11 |
> text(255,0.048,"(b)",cex=1.4) > > par(mfrow=c(1,1)) > par(pty="m") > > posternorm(mumin=250,mumax=400, priormu=328,priorvar=10000, + giventitle=" ") [1] "postmu=" [1] 318.3443 [1] "postvar=" [1] 277.6428 |
となり、事前分布はフラットなもので、事後平均は318.3で、あり、標本平均の318に近く、事後分散は277.6であり、観察された平均の標準誤差の2乗285.6より少し小さい。事前分布の事後推定に対する影響をさらに減少させる必要があるなら事前分散をさらに大きくすべきということになる。
計算が複雑でよくわからないので、コードを弄って、print()命令で、細かく表示させてみる。
|
1 2 3 4 5 6 7 8 9 10 11 12 13 14 15 16 17 18 19 20 21 22 23 24 25 26 27 28 29 30 31 32 33 34 35 36 37 38 39 40 41 42 43 44 45 46 47 48 49 50 51 52 53 54 55 56 57 58 59 60 61 62 63 64 65 66 67 68 69 70 71 72 73 74 75 76 77 78 79 80 81 82 83 84 85 86 87 88 89 90 91 92 93 94 95 96 97 98 99 100 101 102 103 104 105 106 107 108 |
> #normal function to calculate the posterior distribution > > posternorm <- function(mumin=250,mumax=400, priormu=328,priorvar=25, + giventitle="") + + { + + mu <- seq(mumin,mumax,(mumax-mumin)/200) + + #combination of normal prior with normal likelihood + + + chol <- c(274.8501,208.6479,286.7656,413.5640,344.2833,292.2896,296.8147, + 198.4725, 466.3404, 422.0513, 158.3340, 252.9971, 316.3647, 237.2512, + 381.1431, 131.5190, 300.1888, 341.7261, 487.6174, 200.7114, 216.6859, + 466.1822, 455.6942, 449.0033, 290.7924, 275.1898, 292.9542, 328.8997, + 99.7303, 275.1126, 366.7504, 272.8722, 436.3839, 160.2993, 269.5784, + 394.8876, 234.3379, 449.0895, 153.6546, 301.6407, 376.8302, 381.5326, + 378.2189, 607.6112, 162.4040, 251.7461, 274.9384, 272.1369, 712.3612, + 283.9782) + + print ("priormu=");print(priormu) + print ("priorvar=");print(priorvar) + print ("prior_sd=");print(sqrt(priorvar)) + + samplemu <- mean(chol) + print ("samplemu=");print(samplemu) + + samplevar <- var(chol)/length(chol) + print ("samplevar=");print(samplevar) + print ("sample_sd=");print(sqrt(samplevar)) + + + weight0 <- 1/priorvar + print ("weight0_1=");print(weight0) + + weight1 <- 1/samplevar + print ("weight1_1=");print(weight1) + + postvar <- 1/(weight0+weight1) + print ("postvar=");print(postvar) + print ("post_sd=");print(sqrt(postvar)) + + weight0 <- weight0*postvar + print ("weight0_2=");print(weight0) + + weight1 <- weight1*postvar + print ("weight1_2=");print(weight1) + + postmu <- weight0*priormu+weight1*samplemu + print ("postmu=");print(postmu) + + ymax <-max(dnorm(mu,postmu,sqrt(postvar))) + + + plot(mu,dnorm(mu,priormu,sqrt(priorvar)), + xlab=expression(mu),ylab="",type="n",ylim=c(0,ymax*1.05), + main=giventitle,bty="l",cex.lab=1.8,cex=1.2,cex.axis=1.3) + lines(mu,dnorm(mu,priormu,sqrt(priorvar)),lwd=3,lty="dotted") + text(locator(1),"IBBENS prior",adj=0,cex=1.3) + + lines(mu,dnorm(mu,samplemu,sqrt(samplevar)),lwd=3,lty="dashed") + text(locator(1),"IBBENS-2 likelihood",adj=0,cex=1.3) + + lines(mu,dnorm(mu,postmu,sqrt(postvar)),lwd=3) + text(locator(1),"IBBENS-2 posterior",adj=1,cex=1.3) + + print ("postmu=");print(postmu) + print ("postvar=");print(postvar) + print ("post_sd=");print(sqrt(postvar)) + + } > > par (mfrow=c(1,1)) > par(pty="m") > posternorm(mumin=250,mumax=400, priormu=328,priorvar=25) [1] "priormu=" [1] 328 [1] "priorvar=" [1] 25 [1] "prior_sd=" [1] 5 [1] "samplemu=" [1] 318.0686 [1] "samplevar=" [1] 285.5715 [1] "sample_sd=" [1] 16.89886 [1] "weight0_1=" [1] 0.04 [1] "weight1_1=" [1] 0.003501751 [1] "postvar=" [1] 22.98758 [1] "post_sd=" [1] 4.794537 [1] "weight0_2=" [1] 0.9195032 [1] "weight1_2=" [1] 0.08049677 [1] "postmu=" [1] 327.2006 [1] "postmu=" [1] 327.2006 [1] "postvar=" [1] 22.98758 [1] "post_sd=" [1] 4.794537 |
事前分布は、563名の被験者の食事性コレステロール値cholの標本平均は328 mg/dayで、標本標準偏差は120.3 mg/day
尤度は、n=50 で計画され、コレステロール摂取量は318 mg/day、標準偏差は119.5 mg/day、95%
事前平均 328 事前分散 25 標本標準偏差は120.3 mg/day
事前分布が標本分布と同じという仮定から
事前分布分散 = (データ標本標準偏差)^2/被験者数
σ0^2 = σ^2/n0 = 119.5^2 / 563 = 25.4 ≒ 25
要するに、事前分布の標本標準偏差120.3をそのまま用いてはいけないということで、
データ標本の標準偏差を事前分布の標本数で割ったのもを「事前情報と追加データの同等性」を確保するためか?
要するに、事後の平均、分散は以下の式で求めればよいということ!
———————————————————-
μ_bar = n0 * μ0 / (n0 + n) + n * y_bar / (n0 + n)
= 563 * 328 / 613 + 50 * 318 / 613 = 301.25 + 25.94 = 327.2
σ_bar^2 = σ^2 /(n0 + n) = 23.3 σ = 4.8
———————————————————-
標本平均 318.0686 標本分散 285.5715 標本標準偏差は119.5 mg/day
標本分散は、(標本標準偏差)^2/n = 119.5^2 / 50 = 285.605
事後平均 327.2006 事後分散 22.98758 事後標準偏差 4.794537
w0 = 0.9195032
w1 = 0.08049677
μ_bar = w0 * μ0 /(w0 + w1) + w1 * y_bar /(w0 + w1)、
ただし w0 = 1/σ0^2、w1 = 1/(σ^2/n)
事後平均μ_bar = 0.9195032 * 328 /(0.9195032+0.08049677) + 0.08049677 * 318.0686/(0.9195032+0.08049677) = 0.9195032 * 328 / 0.99999997 + 0.08049677 * 318.0686 / 0.99999997 = 301.5970 / 0.99999997 + 25.603 / 0.99999997
= 301.597 + 25.60 = 327.197
事後分散σ_bar^2 = σ^2 /(n0 + n) = 23.3 σ = 4.8
= 1/(1/σ0^2 + n/σ^2) = 1/25 + 50/286 = 1/ 0.2148 = 4.7


