????????????????
Rで楽しむ統計(奥村晴彦著、共立出版)からの学習ノート
????????????????
二項分布 binomial distribution
コインの表が出る確率をθとすれば、裏の出る確率は1-θ
毎回の表裏の出方は独立であるとすると、表がr回でる確率は、
nCr*θ^r*(1-θ)^n-r
である。
nCr = (n r) = n! / (r!(n-r)!)
これをBinom(n, θ)と表し、表が出る回数rが二項分布Binom(n,θ)に従うことを
r~Binom(n, θ)
と表す。
Rでは階乗はfactorial()、組み合わせはchoose()で求める。
|
1 2 3 4 |
> factorial(10)/(factorial(3) * factorial(7)) [1] 120 > choose(10, 3) [1] 120 |
確率0.4で表が出るコインを10回投げて、表が3回出る確率は10C3*0.4^3*0.6^7
dbinom(r, n, θ)でも求められる。
|
1 2 3 4 |
> choose(10,3)* 0.4^3 * 0.6^7 [1] 0.2149908 > dbinom(3, 10, 0.4) [1] 0.2149908 |
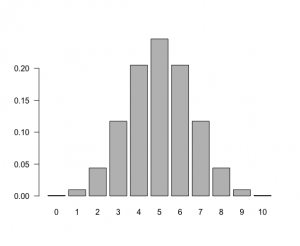
確率0.5で表が出るコインを10回投げて、0〜10枚表が出る確率を全部出力すると、
|
1 2 3 4 |
> dbinom(0:10, 10, 0.5) [1] 0.0009765625 0.0097656250 0.0439453125 0.1171875000 0.2050781250 [6] 0.2460937500 0.2050781250 0.1171875000 0.0439453125 0.0097656250 [11] 0.0009765625 |
barplotで表示してみると、
|
1 |
> barplot(dbinom(0:10,10,0.5), names.arg=0:10, las=1) |

ここで、names.arg変数は軸のラベル指定、lasは軸ラベルを水平に書くオプション。
累積確率はpbinom()関数で求める。
|
1 2 3 4 |
> pbinom(0:10, 10, 0.5) [1] 0.0009765625 0.0107421875 0.0546875000 0.1718750000 0.3769531250 [6] 0.6230468750 0.8281250000 0.9453125000 0.9892578125 0.9990234375 [11] 1.0000000000 |
統計的仮説検定の考え方
「あるコインを10回投げて表が2回しかでなかったことから、このコインは表が出にくいといってよいか?」との疑問に対して、「このコインは表や裏がでやすい」と仮定(帰無仮説null hypothesis)する。
|
1 2 3 |
> dbinom(0:10, 10, 0.5) [1] 0.0009765625 0.0097656250 0.0439453125 0.1171875000 0.2050781250 0.2460937500 [7] 0.2050781250 0.1171875000 0.0439453125 0.0097656250 0.0009765625 |
表が2回出る確率は0.044。さらにそれより珍しい表や裏が1回とか0回の確率の和を求めると、
p = 0.11
p< 0.05を有意と考えるならば、この程度では有意水準0.05に達していないので、この仮説は棄却rejectされる。
二項分布の検定にはbinom.test()関数がある。
|
1 2 3 4 5 6 7 8 9 10 11 12 |
> binom.test(2, 10, 0.5) Exact binomial test data: 2 and 10 number of successes = 2, number of trials = 10, p-value = 0.1094 alternative hypothesis: true probability of success is not equal to 0.5 95 percent confidence interval: 0.02521073 0.55609546 sample estimates: probability of success 0.2 |
p-valueがp値である。 5回の場合は、p=1となり、1回の場合は、9回と同じ、2回の場合は8回と同じ。
|
1 2 3 4 5 6 7 8 9 10 11 12 13 14 15 16 17 18 19 20 21 22 23 24 25 26 27 28 29 30 31 32 33 34 35 36 37 38 |
> binom.test(5, 10, 0.5) Exact binomial test data: 5 and 10 number of successes = 5, number of trials = 10, p-value = 1 alternative hypothesis: true probability of success is not equal to 0.5 95 percent confidence interval: 0.187086 0.812914 sample estimates: probability of success 0.5 > binom.test(9, 10, 0.5) Exact binomial test data: 9 and 10 number of successes = 9, number of trials = 10, p-value = 0.02148 alternative hypothesis: true probability of success is not equal to 0.5 95 percent confidence interval: 0.5549839 0.9974714 sample estimates: probability of success 0.9 > binom.test(8, 10, 0.5) Exact binomial test data: 8 and 10 number of successes = 8, number of trials = 10, p-value = 0.1094 alternative hypothesis: true probability of success is not equal to 0.5 95 percent confidence interval: 0.4439045 0.9747893 sample estimates: probability of success 0.8 |
ついでに1回とか0回も求めてみる.
|
1 2 3 4 5 6 7 8 9 10 11 12 13 14 15 16 17 18 19 20 21 22 23 24 25 |
> binom.test(1, 10, 0.5) Exact binomial test data: 1 and 10 number of successes = 1, number of trials = 10, p-value = 0.02148 alternative hypothesis: true probability of success is not equal to 0.5 95 percent confidence interval: 0.002528579 0.445016117 sample estimates: probability of success 0.1 > binom.test(0, 10, 0.5) Exact binomial test data: 0 and 10 number of successes = 0, number of trials = 10, p-value = 0.001953 alternative hypothesis: true probability of success is not equal to 0.5 95 percent confidence interval: 0.0000000 0.3084971 sample estimates: probability of success 0 |
p値だけをほしいときは、
|
1 2 |
> binom.test(2, 10, 0.5)$p.value [1] 0.109375 |
と打ち込めば良い。
統計的仮説検定に関する議論
Type I error 確率α:帰無仮説が正しいのに棄却してしまうエラー
Type II error確率β:対立仮説が正しいのに帰無仮説が棄却できないエラー
信頼区間
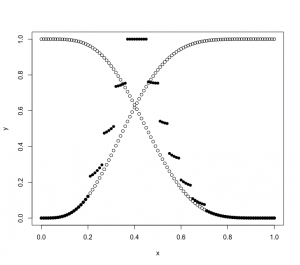
コインを10回投げて、表が4回でるとき、二項分布のパラメータθをいろいろと変えた場合のp値の変化を見てみる。
|
1 2 3 |
> x=(0:100)/100 > y = sapply(x,function(t) binom.test(4, 10, t)$p.value) > plot(x, y, pch=16) |

このグラフからp値>=0.05になる範囲を求めると、0.15<=θ<=0.7091となる。
従って、θが0.15<=θ<=0.7091の範囲の二項分布(10, θ)は、表が4回でるという事象と5%水準で整合する。θがこの範囲であれば、表が4回でてもおかしくないということで、この範囲をθの95%信頼区間95% confidence interval, 95%CI)という。
二項分布のような離散分布では、p値関数は不連続。
不連続でなくするためには片側検定p値を0.025以上になる範囲で求める。
|
1 2 3 4 5 6 7 8 |
> x=(0:100)/100 > y = sapply(x,function(t) binom.test(4, 10, t)$p.value) > plot(x, y, pch=16)ko > x=(0:100)/100 > y = sapply(x,function(t) binom.test(4, 10, t, alternative="less")$p.value) > points(x, y) > y = sapply(x,function(t) binom.test(4, 10, t, alternative="greater")$p.value) > points(x, y) |

この場合、信頼区間は0.1216<=θ<=0.7376
となった。
binom.test()関数を使えば、
|
1 2 3 4 5 6 7 8 9 10 11 12 |
> binom.test(4,10) Exact binomial test data: 4 and 10 number of successes = 4, number of trials = 10, p-value = 0.7539 alternative hypothesis: true probability of success is not equal to 0.5 95 percent confidence interval: 0.1215523 0.7376219 sample estimates: probability of success 0.4 |
古典的なClopper and Pearson法で95%信頼区間を算出する。 一方、両側p値が0.05以上になる確率で定義する信頼区間はexactciパッケージを使って最小尤度法minlikeで求めることができる。
|
1 2 3 4 5 6 7 8 9 10 11 12 13 14 15 16 17 18 19 20 21 22 23 24 25 26 27 28 29 30 |
> install.packages("exactci") also installing the dependency ‘ssanv’ URL 'https://cran.rstudio.com/bin/macosx/el-capitan/contrib/3.4/ssanv_1.1.tgz' を試しています Content type 'application/x-gzip' length 46181 bytes (45 KB) ================================================== downloaded 45 KB URL 'https://cran.rstudio.com/bin/macosx/el-capitan/contrib/3.4/exactci_1.3-3.tgz' を試しています Content type 'application/x-gzip' length 150789 bytes (147 KB) ================================================== downloaded 147 KB The downloaded binary packages are in /var/folders/0j/j_y5y9pj73g9f1r01zqzycxm0000gp/T//RtmprLHWfH/downloaded_packages > library(exactci) 要求されたパッケージ ssanv をロード中です > binom.exact(4, 10, tsmethod="minlike") Exact two-sided binomial test (sum of minimum likelihood method) data: 4 and 10 number of successes = 4, number of trials = 10, p-value = 0.7539 alternative hypothesis: true probability of success is not equal to 0.5 95 percent confidence interval: 0.1500 0.7091 sample estimates: probability of success 0.4 |
と、95%信頼区間は0.15-0.7091と狭まった。
二項分布から正規分布へ
表が出る確率θのコインを一回投げて、表の出る枚数Xを数えれば、結果は確率θでX=1、1-θでX=0となる。このような分布をベルヌーイ分布という。
ベルヌーイ分布の期待値(平均)は
E(X) = θ ? 1 + (1-θ)? 0 = θ となる。
分散は
V(X) = θ * (1-θ)^2 + (1-θ)(0-θ)^2 = θ(1-θ)
二項分布はベルヌーイ分布に従う独立n個の確率変数の和の分布である。
nが大きい二項分布は正規分布に近づく。
Binom(n, θ)->N(nθ, nθ(1-θ))
これが中心極限定理である。
尤度と最尤法
二項分布Binom(10,θ)に従う確率変数Xの確率分布は
10Cx*θ^x*(1-θ)^(10-x)
ここで表が4回とわかった時点で、
L(θ) = 10C4*θ^4*(1-θ)^6
とθの関数となる、これをθの尤度likelihoodという。
もっともらしいθの値は、この尤度を最大にするθであると定め、最尤法と呼ぶ。
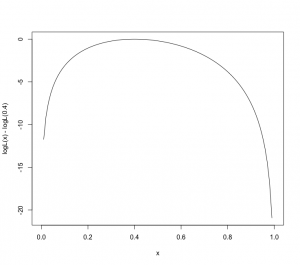
尤度の対数を取って、対数尤度とすると、
logL(θ) = log(10C4) + 4logθ + 6log(1-θ)
θで微分したものを0とおけば、最大値のθが求められる。
d/dθ * logL(θ) = 4/θ – 6/(1-θ) = 0
従ってθ=0.4
|
1 2 |
> logL = function(t) {4*log(t) + 6*log(1-t)} > curve(logL(x) - logL(0.4), xlim =c(0,1)) |
|
1 2 3 4 5 6 7 8 9 10 11 12 13 14 15 16 17 18 19 20 21 22 23 24 25 26 27 28 29 30 31 |
> uniroot(function(x) logL(x)-logL(0.4) + 0.5, c(0,0.4)) $root [1] 0.2552841 $f.root [1] 8.919206e-05 $iter [1] 6 $init.it [1] NA $estim.prec [1] 6.103516e-05 > uniroot(function(x) logL(x)-logL(0.4) + 0.5*1.96^2, c(0,0.4)) $root [1] 0.1456237 $f.root [1] -0.0003031741 $iter [1] 6 $init.it [1] NA $estim.prec [1] 6.103516e-05 |
