BPA: ポアソンGLM 第4章
BPA BUGSで学ぶ階層モデリング Baysian Population Analysis Using WinBUGS, Marc Kery & Michael Schaubの学習ノート
ーーーーーーーーーーーーーーーーーーーーーーーーーーーーーーーーーーーーーーー
GLMの拡張に重要なランダム効果(random effect)について。
固定効果とランダム効果の両方を含むGLMは一般化線形混合モデル(generalized linear mixed model, GLMM)と呼ばれる。さてランダム効果とは?
4.1.1 例
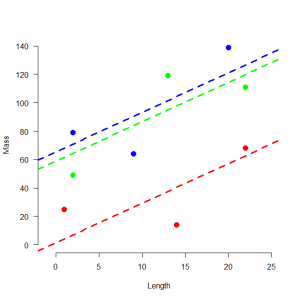
スプクサリヘビの体重ー体長関係を調べる。3つの個体群の9個体の観測値を得た。
|
1 2 3 4 5 6 7 |
> # 4.1. Introduction > # 4.1.1. An example > # Define and plot data > mass <- c(25, 14, 68, 79, 64, 139, 49, 119, 111) > pop <- factor(c(1, 1, 1, 2, 2, 2, 3, 3, 3)) > length <- c(1, 14, 22, 2, 9, 20, 2, 13, 22) > plot(length, mass, col = c(rep("red", 3), rep("blue", 3), rep("green", 3)), xlim = c(-1, 25), ylim = c(0, 140), cex = 1.5, lwd = 2, frame.plot = FALSE, las = 1, pch = 16, xlab = "Length", ylab = "Mass") |
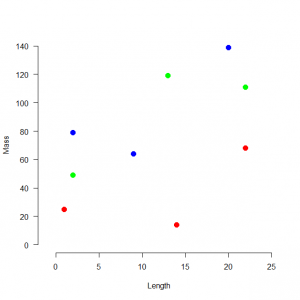
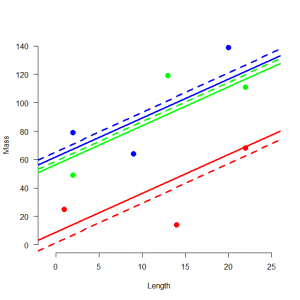
体重と体長には線形の関係があり、その基線は個体群ごとに異なっている。回帰モデルでは、個体群の違いが説明されるべきである。
単純なモデルとして、ヘビiの体重が体長に直線的に依存し、個体群jごとに切片が異なり、平均0, 分散σ^2の正規分布に従く残差εiを含む。
体重i = αj(i) + β * 体長i + εi
εi ~ Normal(0,σ^2)
ランダム効果を考える上で、以下の2つのありうる仮定を考える。
1. 調査個体群はこの3つがすべて
2. 3つの個体群は調査対象だった可能性のある多数の個体群からの標本
統計学的には、
1.固定効果:αjは3つとも完全に独立である。
2.ランダム効果:3つのαjは独立ではない。より多数の効果の集合からの標本
ランダム効果の場合
体重i = αj(i) + β * 体長i + εi
εi ~ Normal(0,σ^2)
αj ~ Normal(μα, σα^2): この行αjがランダム効果
要するにαjを固定するか、正規分布に広げてランダム化するか。
αj(ランダム効果)、β(固定効果)を含むランダム切片モデルrandom-intercepts modelと呼ばれる混合モデルである。
ランダム効果モデルには、制限付き最尤法(REML法)を用いる。モデルのあてはめにはlme4パッケージに含まれるlmer関数を用いる。
固定効果モデルの当てはめ
|
1 2 3 4 5 6 7 8 9 10 11 12 13 14 15 16 17 18 19 20 21 22 23 24 25 |
# Fit fixed-effects model, print regression parameter estimates and plot regression lines > summary(lm <- lm(mass ~ pop-1 + length)) Call: lm(formula = mass ~ pop - 1 + length) Residuals: 1 2 3 4 5 6 7 8 9 20.900 -26.309 5.409 8.211 -26.286 18.075 -15.218 24.143 -8.925 Coefficients: Estimate Std. Error t value Pr(>|t|) pop1 1.315 19.260 0.068 0.9482 pop2 65.218 17.965 3.630 0.0151 * pop3 58.648 19.260 3.045 0.0286 * length 2.785 1.031 2.701 0.0427 * --- Signif. codes: 0 ‘***’ 0.001 ‘**’ 0.01 ‘*’ 0.05 ‘.’ 0.1 ‘ ’ 1 Residual standard error: 25.05 on 5 degrees of freedom Multiple R-squared: 0.951, Adjusted R-squared: 0.9117 F-statistic: 24.24 on 4 and 5 DF, p-value: 0.001798 > abline(lm$coef[1], lm$coef[4], col = "red", lwd = 3, lty = 2) > abline(lm$coef[2], lm$coef[4], col = "blue", lwd = 3, lty = 2) > abline(lm$coef[3], lm$coef[4], col = "green", lwd = 3, lty = 2) |
|
1 2 3 4 5 6 7 8 9 10 11 12 13 14 15 16 17 18 19 20 21 22 23 24 25 26 27 28 29 30 31 32 33 34 35 36 37 |
> install.packages("lme4") > library("lme4") > # Fit mixed model, print random effects and plot regression lines > summary(lmm <- lmer(mass ~ length + (1|pop))) Linear mixed model fit by REML ['lmerMod'] Formula: mass ~ length + (1 | pop) REML criterion at convergence: 77.1 Scaled residuals: Min 1Q Median 3Q Max -1.32064 -0.50966 -0.04148 0.54316 1.07951 Random effects: Groups Name Variance Std.Dev. pop (Intercept) 1026.1 32.03 Residual 627.4 25.05 Number of obs: 9, groups: pop, 3 Fixed effects: Estimate Std. Error t value (Intercept) 42.198 23.583 1.789 length 2.745 1.030 2.665 Correlation of Fixed Effects: (Intr) length -0.510 > ranef(lmm) $pop (Intercept) 1 -33.54774 2 19.46941 3 14.07833 > abline((fixef(lmm)[1]+ranef(lmm)$pop)[1,], fixef(lmm)[2], col = "red", lwd = 3) > abline((fixef(lmm)[1]+ranef(lmm)$pop)[2,], fixef(lmm)[2], col = "blue", lwd = 3) > abline((fixef(lmm)[1]+ranef(lmm)$pop)[3,], fixef(lmm)[2], col = "green", lwd = 3) |
1. 応答変数のランダムな部分(統計分布)
Ci ? Poisson(λi)
2. リンク関数と系統的な部分(対数リンク関数)
log(λi)=ηi
3. 応答の系統的な部分(線形予測子ηi)
線形予測子には、時間に関する三次元多項関数
ηi = α + β1 * Xi^1 + β2 * Xi^2 + β3 * Xi^3
ポアソンGLMM
ηi = α + β1 * Xi^1 + β2 * Xi^2 + β3 * Xi^3 + εi
εi残差の分布
4. 追加された残差εiの分布:正規分布
εi ~ Normal(0,σ^2)
4.2.1 仮想データの生成と解析
|
1 2 3 4 5 6 7 8 9 10 11 12 13 14 15 16 17 18 19 20 21 22 23 24 25 26 27 28 |
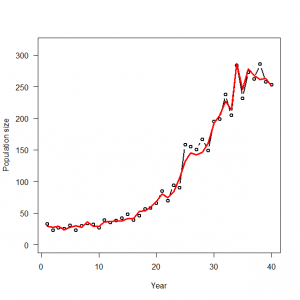
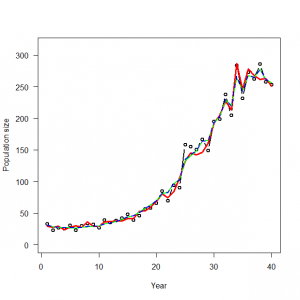
> # 4.2. Accounting for overdispersion by random effects-modeling in R and WinBUGS > # 4.2.1. Generation and analysis of simulated data > data.fn <- function(n = 40, alpha = 3.5576, beta1 = -0.0912, beta2 = 0.0091, beta3 = -0.00014, sd = 0.1){ + # n: Number of years + # alpha, beta1, beta2, beta3: coefficients of a + # cubic polynomial of count on year + # sd: standard deviation of normal distribution assumed for year effects + + # Generate values of time covariate + year <- 1:n + + # First level of noise: generate random year effects + eps <- rnorm(n = n, mean = 0, sd = sd) + + # Signal (plus first level of noise): build up systematic part of the GLM and add the random year effects + log.expected.count <- alpha + beta1 * year + beta2 * year^2 + beta3 * year^3 + eps + expected.count <- exp(log.expected.count) + + # Second level of noise: generate random part of the GLM: Poisson noise around expected counts + C <- rpois(n = n, lambda = expected.count) + + # Plot simulated data + plot(year, C, type = "b", lwd = 2, main = "", las = 1, ylab = "Population size", xlab = "Year", ylim = c(0, 1.1*max(C))) + lines(year, expected.count, type = "l", lwd = 3, col = "red") + + return(list(n = n, alpha = alpha, beta1 = beta1, beta2 = beta2, beta3 = beta3, year = year, sd = sd, expected.count = expected.count, C = C)) + } > data <- data.fn() |
以下の方法では収束が得られない。
|
1 2 3 4 5 6 7 8 9 |
> library(lme4) > yr <- factor(data$year) # Create a factor year > glmm.fit <- glmer(C ~ (1 | yr) + year + I(year^2) + I(year^3), family = poisson, data = data) Warning messages: 1: Some predictor variables are on very different scales: consider rescaling 2: In checkConv(attr(opt, "derivs"), opt$par, ctrl = control$checkConv, : unable to evaluate scaled gradient 3: In checkConv(attr(opt, "derivs"), opt$par, ctrl = control$checkConv, : Model failed to converge: degenerate Hessian with 1 negative eigenvalues |
年の共変量を標準化して改善を図る。
|
1 2 3 4 5 6 7 8 9 10 11 12 13 14 15 16 17 18 19 20 21 22 23 24 25 |
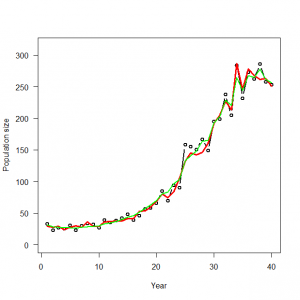
> mny <- mean(data$year) > sdy <- sd(data$year) > cov1 <- (data$year - mny) / sdy > cov2 <- cov1 * cov1 > cov3 <- cov1 * cov1 * cov1 > glmm.fit <- glmer(C ~ (1 | yr) + cov1 + cov2 + cov3, family = poisson, data = data) > glmm.fit Generalized linear mixed model fit by maximum likelihood (Laplace Approximation) [glmerMod] Family: poisson ( log ) Formula: C ~ (1 | yr) + cov1 + cov2 + cov3 Data: data AIC BIC logLik deviance df.resid 307.1971 315.6415 -148.5986 297.1971 35 Random effects: Groups Name Std.Dev. yr (Intercept) 0.06272 Number of obs: 40, groups: yr, 40 Fixed Effects: (Intercept) cov1 cov2 cov3 4.3152 1.2459 0.0651 -0.2190 > > R.predictions <- exp(fixef(glmm.fit)[1] + fixef(glmm.fit)[2]*cov1 + fixef(glmm.fit)[3]*cov2 + fixef(glmm.fit)[4]*cov3 + unlist(ranef(glmm.fit))) > lines(data$year, R.predictions, col = "green", lwd = 2, type = "l") > |
WinBUGSの方法がいかに示される。注意としてWinBUGSの正規分布のパラメータとして精度(分散の逆数)を指定する。
|
1 2 3 4 5 6 7 8 9 10 11 12 13 14 15 16 17 18 19 20 21 22 23 24 25 26 27 28 29 30 31 32 33 34 35 36 37 38 39 40 41 42 |
> # Specify model in BUGS language > sink("GLMM_Poisson.txt") > cat(" + model { + + # Priors + alpha ~ dunif(-20, 20) + beta1 ~ dunif(-10, 10) + beta2 ~ dunif(-10, 10) + beta3 ~ dunif(-10, 10) + tau <- 1 / (sd*sd) + sd ~ dunif(0, 5) + + # Likelihood: note key components of a GLM in one line each + for (i in 1:n){ + C[i] ~ dpois(lambda[i]) # 1. Distribution for random part + log(lambda[i]) <- log.lambda[i] # 2. Link function + log.lambda[i] <- alpha + beta1 * year[i] + beta2 * pow(year[i],2) + beta3 * pow(year[i],3) + eps[i] # 3. Linear predictor incl. random year effect + eps[i] ~ dnorm(0, tau) # 4. Definition of random effects dist + } + } + ",fill = TRUE) > sink() > > # Bundle data > win.data <- list(C = data$C, n = length(data$C), year = cov1) > > # Initial values > inits <- function() list(alpha = runif(1, -2, 2), beta1 = runif(1, -3, 3), sd = runif(1, 0,1)) > > # Parameters monitored > params <- c("alpha", "beta1", "beta2", "beta3", "lambda", "sd", "eps") > > # MCMC settings > ni <- 30000 > nt <- 10 > nb <- 20000 > nc <- 3 > > # Call WinBUGS from R (BRT <1 min) > out <- bugs(win.data, inits, params, "GLMM_Poisson.txt", n.chains = nc, + n.thin = nt, n.iter = ni, n.burnin = nb, debug = TRUE, bugs.directory = bugs.dir, working.directory = getwd()) |
|
1 2 3 4 5 6 7 8 9 10 11 12 13 14 15 16 17 18 19 20 21 22 23 24 25 26 27 28 29 30 31 32 33 34 35 36 37 38 39 40 41 42 43 44 45 46 47 48 49 50 51 52 53 54 55 56 57 58 59 60 61 62 63 64 65 66 67 68 69 70 71 72 73 74 75 76 77 78 79 80 81 82 83 84 85 86 87 88 89 90 91 92 93 94 95 96 97 98 99 100 |
> # Summarize posteriors > print(out, dig = 2) Inference for Bugs model at "GLMM_Poisson.txt", fit using WinBUGS, 3 chains, each with 30000 iterations (first 20000 discarded), n.thin = 10 n.sims = 3000 iterations saved mean sd 2.5% 25% 50% 75% 97.5% Rhat n.eff alpha 4.32 0.03 4.25 4.29 4.32 4.34 4.38 1.00 3000 beta1 1.25 0.06 1.13 1.21 1.25 1.28 1.36 1.00 980 beta2 0.06 0.03 0.01 0.04 0.06 0.08 0.12 1.00 780 beta3 -0.22 0.03 -0.28 -0.24 -0.22 -0.20 -0.16 1.00 580 lambda[1] 31.32 3.73 24.80 28.69 31.12 33.67 39.19 1.00 900 lambda[2] 28.32 3.13 22.43 26.15 28.20 30.31 34.83 1.00 2500 lambda[3] 27.81 2.78 22.64 25.94 27.72 29.59 33.44 1.00 3000 lambda[4] 26.88 2.49 22.26 25.21 26.76 28.48 32.04 1.00 1500 lambda[5] 27.33 2.40 23.08 25.67 27.15 28.82 32.42 1.00 1200 lambda[6] 26.24 2.25 21.96 24.75 26.16 27.65 30.93 1.00 3000 lambda[7] 27.54 2.26 23.37 25.98 27.46 28.96 32.27 1.00 1800 lambda[8] 28.77 2.46 24.49 27.08 28.55 30.23 34.15 1.00 3000 lambda[9] 29.32 2.39 24.97 27.68 29.20 30.80 34.31 1.00 3000 lambda[10] 29.82 2.36 25.18 28.23 29.81 31.33 34.58 1.00 1000 lambda[11] 33.16 2.74 28.18 31.31 32.93 34.83 39.29 1.00 3000 lambda[12] 34.32 2.67 29.32 32.58 34.24 35.96 39.91 1.00 3000 lambda[13] 36.92 2.94 31.37 35.03 36.85 38.75 43.02 1.00 930 lambda[14] 40.17 3.10 34.08 38.17 40.08 42.07 46.91 1.00 2000 lambda[15] 44.27 3.41 38.15 41.99 43.97 46.25 51.91 1.00 2200 lambda[16] 45.77 3.57 38.45 43.38 45.79 48.21 52.65 1.00 1200 lambda[17] 50.91 3.77 43.17 48.44 50.91 53.32 58.53 1.00 590 lambda[18] 57.58 4.12 49.58 54.81 57.45 60.14 65.94 1.00 1300 lambda[19] 62.39 4.41 53.61 59.55 62.42 65.14 71.64 1.01 440 lambda[20] 69.60 4.84 59.73 66.40 69.65 72.66 79.27 1.00 2500 lambda[21] 80.99 5.42 70.92 77.37 80.69 84.33 92.09 1.00 3000 lambda[22] 82.42 5.90 70.67 78.49 82.57 86.56 93.33 1.00 2700 lambda[23] 96.79 5.97 85.25 92.95 96.68 100.40 109.40 1.00 3000 lambda[24] 102.45 6.97 88.00 97.99 102.60 107.30 115.50 1.00 990 lambda[25] 135.54 9.92 119.30 128.20 134.80 141.50 157.60 1.00 1300 lambda[26] 142.56 8.65 127.59 136.60 141.80 147.70 162.30 1.00 1300 lambda[27] 148.95 8.28 133.10 143.60 148.60 154.10 165.80 1.00 2100 lambda[28] 164.00 9.06 147.10 157.97 163.70 169.70 183.50 1.00 3000 lambda[29] 164.29 10.19 142.60 157.67 164.50 171.70 182.80 1.00 750 lambda[30] 193.20 9.91 174.40 186.80 192.90 199.30 213.30 1.00 2500 lambda[31] 202.85 10.60 182.50 195.80 203.10 209.80 223.70 1.00 3000 lambda[32] 230.39 12.16 209.00 221.70 229.40 238.22 256.30 1.00 3000 lambda[33] 218.88 11.89 194.89 210.77 219.20 227.32 240.50 1.00 3000 lambda[34] 266.81 14.28 241.50 256.20 266.30 276.10 297.00 1.00 570 lambda[35] 242.85 12.67 216.69 234.67 243.30 251.80 266.40 1.00 1200 lambda[36] 268.27 13.08 244.20 259.40 267.80 276.70 294.70 1.00 3000 lambda[37] 264.68 12.62 240.30 256.20 264.50 272.90 290.10 1.00 2900 lambda[38] 278.02 13.60 254.30 268.50 277.60 286.70 306.80 1.00 1100 lambda[39] 261.90 13.45 235.70 252.90 261.65 270.60 289.40 1.00 3000 lambda[40] 255.77 13.39 230.50 246.80 255.60 264.50 282.60 1.00 3000 sd 0.07 0.03 0.02 0.06 0.07 0.09 0.13 1.02 290 eps[1] 0.01 0.07 -0.13 -0.03 0.01 0.05 0.16 1.00 3000 eps[2] -0.03 0.07 -0.19 -0.07 -0.02 0.02 0.11 1.00 2700 eps[3] 0.00 0.07 -0.15 -0.05 0.00 0.04 0.14 1.00 3000 eps[4] -0.01 0.07 -0.16 -0.05 -0.01 0.03 0.13 1.00 3000 eps[5] 0.02 0.07 -0.12 -0.02 0.02 0.06 0.17 1.00 3000 eps[6] -0.02 0.07 -0.17 -0.07 -0.02 0.02 0.12 1.00 3000 eps[7] 0.01 0.07 -0.12 -0.03 0.01 0.06 0.16 1.00 2500 eps[8] 0.03 0.07 -0.11 -0.01 0.03 0.08 0.19 1.00 3000 eps[9] 0.01 0.07 -0.12 -0.03 0.01 0.06 0.16 1.00 3000 eps[10] -0.01 0.07 -0.17 -0.06 -0.01 0.03 0.12 1.00 1500 eps[11] 0.04 0.07 -0.10 -0.01 0.03 0.08 0.19 1.00 3000 eps[12] 0.00 0.07 -0.13 -0.04 0.00 0.05 0.14 1.00 3000 eps[13] 0.00 0.07 -0.14 -0.04 0.00 0.05 0.15 1.00 1300 eps[14] 0.01 0.07 -0.13 -0.03 0.01 0.05 0.15 1.00 3000 eps[15] 0.02 0.07 -0.11 -0.02 0.02 0.06 0.17 1.00 1200 eps[16] -0.04 0.07 -0.20 -0.08 -0.03 0.01 0.09 1.00 3000 eps[17] -0.03 0.07 -0.17 -0.07 -0.02 0.02 0.10 1.00 680 eps[18] 0.00 0.07 -0.13 -0.05 0.00 0.04 0.13 1.00 2300 eps[19] -0.03 0.07 -0.17 -0.07 -0.02 0.01 0.10 1.00 500 eps[20] -0.02 0.07 -0.17 -0.06 -0.02 0.02 0.10 1.00 3000 eps[21] 0.02 0.06 -0.10 -0.02 0.02 0.06 0.15 1.00 3000 eps[22] -0.07 0.07 -0.22 -0.11 -0.06 -0.02 0.06 1.00 3000 eps[23] -0.01 0.06 -0.14 -0.05 -0.01 0.02 0.10 1.00 3000 eps[24] -0.06 0.07 -0.21 -0.10 -0.06 -0.02 0.05 1.00 940 eps[25] 0.11 0.07 -0.01 0.06 0.11 0.16 0.27 1.00 1500 eps[26] 0.06 0.06 -0.04 0.02 0.06 0.10 0.20 1.00 2100 eps[27] 0.01 0.06 -0.10 -0.02 0.01 0.05 0.13 1.00 3000 eps[28] 0.01 0.06 -0.09 -0.02 0.01 0.05 0.13 1.00 3000 eps[29] -0.07 0.06 -0.21 -0.11 -0.07 -0.03 0.03 1.01 430 eps[30] 0.01 0.05 -0.09 -0.02 0.01 0.04 0.11 1.00 3000 eps[31] -0.02 0.05 -0.12 -0.05 -0.01 0.02 0.09 1.00 2900 eps[32] 0.04 0.05 -0.05 0.00 0.04 0.08 0.16 1.00 3000 eps[33] -0.07 0.06 -0.18 -0.10 -0.06 -0.03 0.03 1.00 980 eps[34] 0.08 0.06 -0.02 0.04 0.08 0.12 0.20 1.00 870 eps[35] -0.05 0.05 -0.17 -0.08 -0.05 -0.01 0.04 1.00 2200 eps[36] 0.02 0.05 -0.08 -0.01 0.02 0.05 0.13 1.00 3000 eps[37] -0.01 0.05 -0.11 -0.04 -0.01 0.02 0.09 1.00 820 eps[38] 0.04 0.05 -0.06 0.00 0.03 0.07 0.14 1.00 3000 eps[39] -0.02 0.05 -0.13 -0.05 -0.01 0.02 0.09 1.00 1800 eps[40] -0.02 0.06 -0.14 -0.05 -0.01 0.02 0.10 1.00 920 deviance 285.79 8.34 270.90 279.90 285.10 291.00 304.00 1.01 440 For each parameter, n.eff is a crude measure of effective sample size, and Rhat is the potential scale reduction factor (at convergence, Rhat=1). DIC info (using the rule, pD = Dbar-Dhat) pD = 16.7 and DIC = 302.4 DIC is an estimate of expected predictive error (lower deviance is better). > |
|
1 2 |
> WinBUGS.predictions <- out$mean$lambda > lines(data$year, WinBUGS.predictions, col = "blue", lwd = 2, type = "l", lty = 2) |
|
1 2 3 4 5 6 7 8 9 10 11 12 13 14 15 16 17 18 19 20 21 22 23 24 25 26 27 28 29 30 31 32 33 34 35 36 37 38 39 40 41 42 43 44 45 46 47 48 49 50 51 52 53 54 55 56 57 58 59 60 |
> glm.fit <- glm(C ~ cov1 + cov2 + cov3, family = poisson, data = data) > summary(glm.fit) Call: glm(formula = C ~ cov1 + cov2 + cov3, family = poisson, data = data) Deviance Residuals: Min 1Q Median 3Q Max -2.1620 -0.6432 0.0419 0.6089 3.2126 Coefficients: Estimate Std. Error z value Pr(>|z|) (Intercept) 4.31689 0.02896 149.057 < 2e-16 *** cov1 1.25160 0.04404 28.418 < 2e-16 *** cov2 0.06506 0.02345 2.774 0.00553 ** cov3 -0.22196 0.02307 -9.621 < 2e-16 *** --- Signif. codes: 0 ‘***’ 0.001 ‘**’ 0.01 ‘*’ 0.05 ‘.’ 0.1 ‘ ’ 1 (Dispersion parameter for poisson family taken to be 1) Null deviance: 2835.20 on 39 degrees of freedom Residual deviance: 52.52 on 36 degrees of freedom AIC: 309.17 Number of Fisher Scoring iterations: 4 > summary(glmm.fit) Generalized linear mixed model fit by maximum likelihood (Laplace Approximation) [glmerMod] Family: poisson ( log ) Formula: C ~ (1 | yr) + cov1 + cov2 + cov3 Data: data AIC BIC logLik deviance df.resid 307.2 315.6 -148.6 297.2 35 Scaled residuals: Min 1Q Median 3Q Max -1.46301 -0.53955 0.03808 0.51588 2.16822 Random effects: Groups Name Variance Std.Dev. yr (Intercept) 0.003934 0.06272 Number of obs: 40, groups: yr, 40 Fixed effects: Estimate Std. Error z value Pr(>|z|) (Intercept) 4.31520 0.03278 131.64 < 2e-16 *** cov1 1.24593 0.05298 23.52 < 2e-16 *** cov2 0.06510 0.02624 2.48 0.0131 * cov3 -0.21903 0.02778 -7.88 3.19e-15 *** --- Signif. codes: 0 ‘***’ 0.001 ‘**’ 0.01 ‘*’ 0.05 ‘.’ 0.1 ‘ ’ 1 Correlation of Fixed Effects: (Intr) cov1 cov2 cov1 -0.397 cov2 -0.712 0.209 cov3 0.397 -0.890 -0.426 |
4.2.2 実際のデータの解析
|
1 2 3 4 5 6 7 8 9 10 11 12 13 14 15 16 17 18 19 20 21 22 23 24 25 26 27 28 29 30 31 32 33 34 35 36 37 38 39 |
> # 4.2.2. Analysis of real data > # Read data again > peregrine <- read.table("falcons.txt", header = TRUE) > > yr <- factor(peregrine$Year) > mny <- mean(peregrine$Year) > sdy <- sd(peregrine$Year) > cov1 <- (peregrine$Year - mny) / sdy > cov2 <- cov1 * cov1 > cov3 <- cov1 * cov1 * cov1 > glmm <- glmer(peregrine$Pairs ~ (1 | yr) + cov1 + cov2 + cov3, family = poisson, data = peregrine) > glmm Generalized linear mixed model fit by maximum likelihood (Laplace Approximation) [glmerMod] Family: poisson ( log ) Formula: peregrine$Pairs ~ (1 | yr) + cov1 + cov2 + cov3 Data: peregrine AIC BIC logLik deviance df.resid 318.9327 327.3771 -154.4664 308.9327 35 Random effects: Groups Name Std.Dev. yr (Intercept) 0.09941 Number of obs: 40, groups: yr, 40 Fixed Effects: (Intercept) cov1 cov2 cov3 4.2121 1.1908 0.0172 -0.2716 > > # Bundle data > win.data <- list(C = peregrine$Pairs, n = length(peregrine$Pairs), year = cov1) > > # MCMC settings (may have to adapt) > ni <- 30000 > nt <- 10 > nb <- 20000 > nc <- 3 > > # Call WinBUGS from R (BRT < 1 min) > out <- bugs(win.data, inits, params, "GLMM_Poisson.txt", n.chains = nc, + n.thin = nt, n.iter = ni, n.burnin = nb, debug = TRUE, bugs.directory = bugs.dir, working.directory = getwd()) |
|
1 2 3 4 5 6 7 8 9 10 11 12 13 14 15 16 17 18 19 20 21 22 23 24 25 26 27 28 29 30 31 32 33 34 35 36 37 38 39 40 41 42 43 44 45 46 47 48 49 50 51 52 53 54 55 56 57 58 59 60 61 62 63 64 65 66 67 68 69 70 71 72 73 74 75 76 77 78 79 80 81 82 83 84 85 86 87 88 89 90 91 92 93 94 95 96 97 98 99 |
> # Summarize posteriors > print(out, dig = 3) Inference for Bugs model at "GLMM_Poisson.txt", fit using WinBUGS, 3 chains, each with 30000 iterations (first 20000 discarded), n.thin = 10 n.sims = 3000 iterations saved mean sd 2.5% 25% 50% 75% 97.5% Rhat n.eff alpha 4.210 0.041 4.129 4.183 4.211 4.238 4.290 1.001 3000 beta1 1.203 0.073 1.064 1.153 1.201 1.253 1.347 1.002 1200 beta2 0.017 0.032 -0.046 -0.005 0.017 0.038 0.078 1.003 810 beta3 -0.277 0.038 -0.350 -0.304 -0.275 -0.252 -0.204 1.002 1200 lambda[1] 34.347 4.377 26.469 31.280 34.145 37.070 43.621 1.002 1900 lambda[2] 35.693 4.411 28.019 32.507 35.450 38.442 44.930 1.004 640 lambda[3] 32.347 3.882 25.460 29.587 32.105 34.830 40.551 1.004 540 lambda[4] 30.273 3.532 24.039 27.780 30.030 32.410 38.001 1.002 1300 lambda[5] 25.164 2.996 19.360 23.120 25.090 27.162 31.380 1.001 3000 lambda[6] 24.311 2.853 18.700 22.400 24.330 26.212 29.920 1.001 3000 lambda[7] 25.096 2.838 19.439 23.177 25.065 27.010 30.710 1.001 3000 lambda[8] 25.009 2.853 19.530 23.087 24.970 26.890 30.770 1.001 3000 lambda[9] 24.726 2.944 18.939 22.750 24.720 26.660 30.630 1.001 2000 lambda[10] 26.333 3.037 20.210 24.257 26.370 28.380 32.262 1.001 3000 lambda[11] 27.940 3.121 21.820 25.807 27.960 29.970 34.090 1.001 3000 lambda[12] 30.252 3.280 23.749 27.960 30.255 32.542 36.750 1.002 1200 lambda[13] 32.368 3.397 25.810 30.107 32.320 34.622 39.040 1.001 3000 lambda[14] 37.467 3.786 30.399 34.907 37.260 39.870 45.510 1.001 3000 lambda[15] 40.950 4.085 33.430 38.230 40.755 43.440 49.471 1.001 3000 lambda[16] 44.802 4.405 36.450 41.790 44.580 47.652 53.941 1.004 550 lambda[17] 51.394 4.875 42.490 48.057 51.210 54.450 61.701 1.001 3000 lambda[18] 54.079 4.961 45.039 50.830 53.745 57.072 64.991 1.002 1600 lambda[19] 60.252 5.486 50.010 56.540 60.090 63.635 71.650 1.002 1600 lambda[20] 66.795 5.708 56.370 62.880 66.450 70.300 79.140 1.001 3000 lambda[21] 76.507 6.565 64.759 71.747 76.200 80.592 90.222 1.001 2500 lambda[22] 84.631 6.858 71.848 80.077 84.180 89.020 99.252 1.001 3000 lambda[23] 91.368 7.309 78.200 86.387 90.770 96.010 106.702 1.001 2200 lambda[24] 102.052 7.751 87.778 96.840 101.600 107.000 118.200 1.002 1600 lambda[25] 110.647 8.300 95.319 105.000 110.300 116.100 127.802 1.001 3000 lambda[26] 118.803 8.833 102.697 112.800 118.400 124.600 137.100 1.001 3000 lambda[27] 129.769 9.156 112.300 123.500 129.600 135.800 148.405 1.001 3000 lambda[28] 135.076 9.317 117.300 128.800 134.700 141.000 154.000 1.001 2100 lambda[29] 144.359 9.958 125.400 137.700 144.000 150.500 164.802 1.001 3000 lambda[30] 152.412 10.522 132.600 145.200 152.000 159.500 173.102 1.001 3000 lambda[31] 157.411 10.509 137.000 150.400 157.000 164.300 178.505 1.001 2800 lambda[32] 171.661 11.036 150.600 164.300 171.100 178.900 194.302 1.001 3000 lambda[33] 167.174 10.932 146.797 159.800 167.000 174.300 189.100 1.002 1200 lambda[34] 169.384 10.915 148.097 161.900 169.600 176.825 190.602 1.001 3000 lambda[35] 167.645 10.905 146.700 160.000 167.650 175.100 189.302 1.002 1600 lambda[36] 151.011 11.206 129.100 143.500 150.800 158.400 173.502 1.001 3000 lambda[37] 163.123 10.889 142.300 155.600 163.000 170.800 184.000 1.001 3000 lambda[38] 158.031 10.632 137.000 150.775 157.800 165.500 178.807 1.001 3000 lambda[39] 180.305 12.289 157.200 171.800 179.800 187.800 206.102 1.001 3000 lambda[40] 177.357 13.096 153.397 168.000 176.900 185.900 204.707 1.001 3000 sd 0.118 0.031 0.062 0.097 0.116 0.137 0.182 1.003 2100 eps[1] -0.007 0.105 -0.225 -0.070 -0.004 0.058 0.198 1.001 3000 eps[2] 0.122 0.104 -0.066 0.050 0.114 0.192 0.334 1.001 3000 eps[3] 0.094 0.106 -0.106 0.022 0.087 0.160 0.316 1.002 1900 eps[4] 0.080 0.107 -0.115 0.007 0.074 0.146 0.303 1.001 3000 eps[5] -0.071 0.107 -0.296 -0.139 -0.066 0.002 0.120 1.001 3000 eps[6] -0.088 0.108 -0.323 -0.153 -0.081 -0.012 0.103 1.001 3000 eps[7] -0.053 0.105 -0.273 -0.120 -0.049 0.017 0.141 1.002 1100 eps[8] -0.068 0.105 -0.287 -0.138 -0.062 0.001 0.131 1.004 1600 eps[9] -0.105 0.108 -0.350 -0.171 -0.098 -0.031 0.087 1.002 1600 eps[10] -0.079 0.107 -0.309 -0.148 -0.074 -0.005 0.120 1.001 3000 eps[11] -0.068 0.103 -0.282 -0.132 -0.063 0.002 0.126 1.002 1100 eps[12] -0.047 0.100 -0.260 -0.112 -0.042 0.018 0.147 1.003 740 eps[13] -0.046 0.101 -0.260 -0.109 -0.042 0.019 0.142 1.001 2300 eps[14] 0.025 0.099 -0.169 -0.039 0.022 0.088 0.224 1.001 3000 eps[15] 0.031 0.097 -0.163 -0.033 0.029 0.093 0.225 1.001 3000 eps[16] 0.032 0.095 -0.157 -0.029 0.031 0.093 0.227 1.003 680 eps[17] 0.076 0.094 -0.100 0.012 0.073 0.137 0.275 1.002 1900 eps[18] 0.030 0.090 -0.140 -0.027 0.027 0.089 0.220 1.002 1700 eps[19] 0.038 0.090 -0.136 -0.021 0.036 0.097 0.219 1.002 1100 eps[20] 0.039 0.086 -0.124 -0.018 0.037 0.094 0.216 1.001 3000 eps[21] 0.072 0.087 -0.091 0.016 0.069 0.129 0.247 1.002 1700 eps[22] 0.071 0.082 -0.088 0.016 0.069 0.125 0.235 1.001 3000 eps[23] 0.046 0.081 -0.111 -0.007 0.046 0.099 0.204 1.002 1400 eps[24] 0.058 0.078 -0.095 0.006 0.057 0.108 0.215 1.001 3000 eps[25] 0.044 0.078 -0.110 -0.009 0.043 0.095 0.200 1.001 3000 eps[26] 0.024 0.077 -0.131 -0.027 0.024 0.076 0.170 1.001 2500 eps[27] 0.027 0.074 -0.123 -0.023 0.028 0.078 0.169 1.001 3000 eps[28] -0.012 0.074 -0.161 -0.061 -0.011 0.036 0.132 1.001 2900 eps[29] -0.017 0.074 -0.165 -0.067 -0.016 0.031 0.126 1.002 2300 eps[30] -0.026 0.074 -0.175 -0.075 -0.026 0.023 0.118 1.001 2300 eps[31] -0.047 0.073 -0.192 -0.097 -0.045 0.004 0.088 1.001 3000 eps[32] -0.003 0.069 -0.138 -0.048 -0.004 0.042 0.135 1.001 3000 eps[33] -0.060 0.071 -0.208 -0.108 -0.058 -0.012 0.074 1.001 3000 eps[34] -0.065 0.071 -0.207 -0.111 -0.064 -0.016 0.068 1.001 2700 eps[35] -0.080 0.072 -0.224 -0.126 -0.079 -0.030 0.055 1.002 2000 eps[36] -0.174 0.080 -0.335 -0.225 -0.172 -0.120 -0.022 1.001 3000 eps[37] -0.070 0.075 -0.224 -0.119 -0.069 -0.022 0.077 1.001 3000 eps[38] -0.059 0.076 -0.213 -0.108 -0.055 -0.009 0.085 1.001 3000 eps[39] 0.134 0.084 -0.022 0.077 0.132 0.188 0.307 1.001 3000 eps[40] 0.198 0.099 0.018 0.130 0.192 0.259 0.405 1.001 3000 deviance 286.105 9.443 269.597 279.500 285.400 292.025 305.802 1.001 2200 For each parameter, n.eff is a crude measure of effective sample size, and Rhat is the potential scale reduction factor (at convergence, Rhat=1). DIC info (using the rule, pD = Dbar-Dhat) pD = 22.0 and DIC = 308.2 DIC is an estimate of expected predictive error (lower deviance is better). |
