From Bayesian Computation with R
アメリカ大学生の睡眠習慣。何割の学生が最低8時間の睡眠を取っているか?8時間の睡眠を取っている学生の割合をpとする。
ベイズでは、事前分布として主観を使える。論文データなどを参考に、p=0.3と考えてみる。
8時間以上の睡眠を成功s、それ未満をfとする。
尤度関数はL(p)∝p^s*(1-p)^f
事後密度は、ベイズの法則で、g(p|data)∝g(p)L(p)
事前密度gに関して、3つの異なる選択肢が示される。
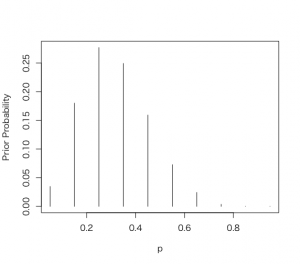
> p = seq(0.05, 0.95, by = 0.1)
> prior = c(1, 5.2, 8, 7.2, 4.6, 2.1, 0.7, 0.1, 0, 0)
> prior = prior/sum(prior)
> plot(p, prior, type = “h”, ylab=”Prior Probability”)
> data <- c(11,16)
> post <- pdisc(p, prior, data)
> round(cbind(p, prior, post), 2)
p prior post
[1,] 0.05 0.03 0.00
[2,] 0.15 0.18 0.00
[3,] 0.25 0.28 0.13
[4,] 0.35 0.25 0.48
[5,] 0.45 0.16 0.33
[6,] 0.55 0.07 0.06
[7,] 0.65 0.02 0.00
[8,] 0.75 0.00 0.00
[9,] 0.85 0.00 0.00
[10,] 0.95 0.00 0.00
pdisc {LearnBayes} R Documentation
Posterior distribution for a proportion with discrete priors
Description
Computes the posterior distribution for a proportion for a discrete prior distribution.
Usage
pdisc(p, prior, data)
Arguments
p
vector of proportion values
prior
vector of prior probabilities
data
vector consisting of number of successes and number of failures
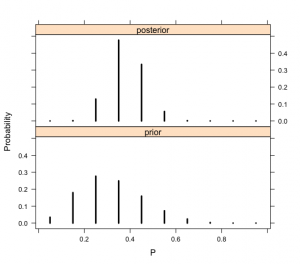
> library(lattice)
> PRIOR=data.frame(“prior”,p,prior)
> POST=data.frame(“posterior”,p,post)
> names(PRIOR)=c(“Type”,”P”,”Probability”)
> names(POST)=c(“Type”,”P”,”Probability”)
> data=rbind(PRIOR,POST)
>
> xyplot(Probability~P|Type,data=data,layout=c(1,2),
+ type=”h”,lwd=3,col=”black”)
次にベータ事前分布を利用してみる。
g(p)∝p^(a-1)*(1-p)^(b-1)
aとbは、超パラメータである。
分布の分位点に仮定をおいて、間接的にaとbを決定する。
中央値が0.3、90%分位点が0.5という確信を持つ場合。
beta.select()関数
beta.select {LearnBayes} R Documentation
Selection of Beta Prior Given Knowledge of Two Quantiles
Description
Finds the shape parameters of a beta density that matches knowledge of two quantiles of the distribution.
Usage
beta.select(quantile1, quantile2)
Arguments
quantile1
list with components p, the value of the first probability, and x, the value of the first quantile
quantile2
list with components p, the value of the second probability, and x, the value of the second quantile
> quantile2<-list(p=.9, x= .5)
> quantile1<-list(p=.5, x= .3)
> beta.select(quantile1, quantile2)
[1] 3.26 7.19
> a <- 3.26
> b <- 7.18
> s <- 11
> f <- 16
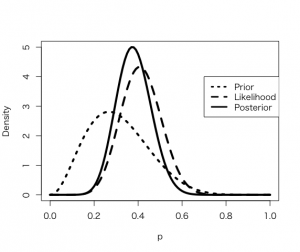
> curve(dbeta(x,a+s, b+f), from =0, to = 1, xlab =”p”, ylab = “Density”, lty = 1, lwd =4)
> curve(dbeta(x,s+1, f+1), add =TRUE, lty=2, lwd=4)
> curve(dbeta(x,a,b), add =TRUE, lty=3, lwd=4)
> legend(.7, 4, c(“Prior”, “Likelihood”, “Posterior”), lty=c(3,2,1), lwd=c(3,3,3))
ベータ事後分布を分析
> 1 – pbeta(0.5, a + s, b + f)
[1] 0.06921827
pbeta
Beta {stats} R Documentation
The Beta Distribution
Description
Density, distribution function, quantile function and random generation for the Beta distribution with parameters shape1 and shape2 (and optional non-centrality parameter ncp).
Usage
dbeta(x, shape1, shape2, ncp = 0, log = FALSE)
pbeta(q, shape1, shape2, ncp = 0, lower.tail = TRUE, log.p = FALSE)
qbeta(p, shape1, shape2, ncp = 0, lower.tail = TRUE, log.p = FALSE)
rbeta(n, shape1, shape2, ncp = 0)
Arguments
x, q
vector of quantiles.
p
vector of probabilities.
n
number of observations. If length(n) > 1, the length is taken to be the number required.
shape1, shape2
non-negative parameters of the Beta distribution.
ncp
non-centrality parameter.
log, log.p
logical; if TRUE, probabilities p are given as log(p).
lower.tail
logical; if TRUE (default), probabilities are P[X ? x], otherwise, P[X > x].
> qbeta(c(0.05, 0.95), a + s, b + f)
[1] 0.2556027 0.5134840
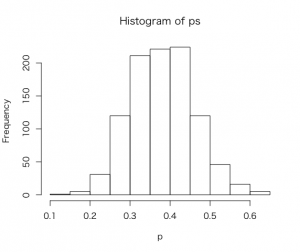
他にもベータ事後密度分布を要約する方法として。rbeta()関数からランダムな乱数を生成。
> ps = rbeta(1000, a + s, b + f)
> hist(ps,xlab=”p”)
pが0.5以上となる確率は
> sum(ps >= 0.5)/1000
[1] 0.067
90%区間は、
> quantile(ps, c(0.05, 0.95))
5% 95%
0.2624984 0.5106304
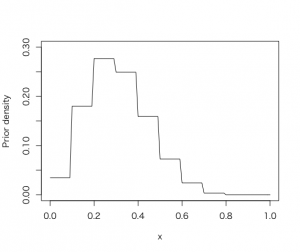
3つめの方法として、任意の事前分布を選んで、ブルートフォース(力任せ方)で事後密度の計算を要約する。
> midpt <-seq(0.05, 0.95, by = 0.1)
> prior <- c(1, 5.2, 8, 7.2, 4.6, 2.1, 0.7, 0.1, 0, 0)
> prior <- prior/sum(prior)
> curve(histprior(x, midpt, prior), from =0, to =1, ylab=”Prior density”, ylim=c(0,.3))
>
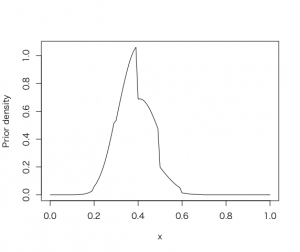
尤度関数beta(s+1, f+1)をdbeta()関数を使って、グリッド上の事後分布を計算する。
> curve(histprior(x, midpt, prior) * dbeta(x, s+1, f+1), from =0, to = 1, ylab=”Prior density”)
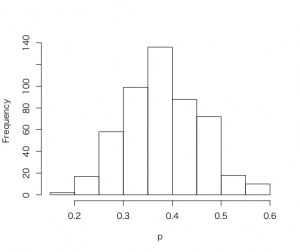
このグリッド上の積を確率に変える。
> p<-seq(0,1,length=500)
> post <- histprior(p, midpt, prior)* dbeta(p,s+1, f+1)
> post = post/sum(post)
> ps <- sample(p, replace=TRUE, prob =post)
> hist(ps, xlab=”p”, main =””)
<推論>
新たな20名について調査をする。何人yが十分に睡眠を取っているか?
pに離散分布を割り当てたときの予測確率はpdiscp()関数で計算。
将来のサンプルサイズと成功数ys
pdiscp {LearnBayes} R Documentation
Predictive distribution for a binomial sample with a discrete prior
Description
Computes predictive distribution for number of successes of future binomial experiment with a discrete distribution for the proportion.
Usage
pdiscp(p, probs, n, s)
Arguments
p
vector of proportion values
probs
vector of probabilities
n
size of future binomial sample
s
vector of number of successes for future binomial experiment
p<-seq(0.05, 0.95, by =.1)
> p<-seq(0.05, 0.95, by =.1)
> prior <- c(1, 5.2, 8, 7.2, 4.6, 2.1, 0.7, 0.1, 0, 0)
> prior <- prior/sum(prior)
> m <- 20; ys <- 0:20
> pred <- pdiscp(p, prior, m, ys)
> round(cbind(0:20, pred), 3)
pred
[1,] 0 0.020
[2,] 1 0.044
[3,] 2 0.069
[4,] 3 0.092
[5,] 4 0.106
[6,] 5 0.112
[7,] 6 0.110
[8,] 7 0.102
[9,] 8 0.089
[10,] 9 0.074
[11,] 10 0.059
[12,] 11 0.044
[13,] 12 0.031
[14,] 13 0.021
[15,] 14 0.013
[16,] 15 0.007
[17,] 16 0.004
[18,] 17 0.002
[19,] 18 0.001
[20,] 19 0.000
[21,] 20 0.000
次にベータ事前密度分布を用いて、モデル化。
ベータ密度を利用した予測確率はpbetap()関数で計算。
> barplot(table(Dvds))
> hist(Dvds)
> boxplot(Height~Gender, ylab=”Height”)
>
> output <- boxplot(Height~Gender)
> output
$stats
[,1] [,2]
[1,] 57.75 65
[2,] 63.00 69
[3,] 64.50 71
[4,] 67.00 72
[5,] 73.00 76
$n
[1] 428 219
$conf
[,1] [,2]
[1,] 64.19451 70.6797
[2,] 64.80549 71.3203
$out
[1] 56 76 55 56 76 54 54 84 78 77 56 63 77 79 62 62 61 79 59 61 78 62
$group
[1] 1 1 1 1 1 1 1 1 1 1 1 2 2 2 2 2 2 2 2 2 2 2
$names
[1] “female” “male”
> mean(height)
mean(height) でエラー: オブジェクト ‘height’ がありません
> mean(Height)
[1] NA
> Height
[1] 67.000 64.000 61.000 61.000 70.000 63.000 61.000 64.000 66.000 65.000 72.000
[12] 63.000 67.000 63.500 72.000 65.000 62.000 66.000 71.000 64.000 71.000 61.000
[23] 56.000 71.000 63.000 65.000 68.000 64.000 59.000 61.500 70.000 64.000 63.000
[34] 71.000 73.000 66.000 66.000 63.000 67.000 76.000 61.000 63.000 62.000 65.000
[45] 68.000 63.000 62.000 72.000 66.000 62.000 67.000 64.500 66.000 65.000 NA
[56] 65.000 65.000 67.000 64.000 67.000 64.000 66.000 67.000 65.000 72.000 73.000
[67] 71.000 73.000 72.000 68.000 64.000 68.000 62.000 66.000 76.000 55.000 69.000
[78] 71.000 68.000 68.000 62.000 73.000 62.000 61.000 70.000 68.000 60.000 68.000
[89] 71.000 56.000 67.000 69.000 74.000 72.000 76.000 76.000 70.000 64.000 72.000
[100] 66.000 63.000 63.000 64.000 72.000 69.000 54.000 64.000 62.000 70.000 64.000
[111] 75.000 NA 64.000 71.000 66.000 71.000 65.000 72.000 64.500 65.000 74.000
[122] 61.000 69.000 70.000 74.000 64.000 62.000 70.000 68.000 62.000 64.500 67.000
[133] 71.000 72.000 62.000 65.000 68.000 66.000 62.000 70.500 70.000 67.000 73.000
[144] 66.000 68.000 61.000 63.000 74.000 66.000 69.000 63.000 72.000 67.000 71.000
[155] 75.000 62.500 59.750 64.000 67.000 70.000 77.000 69.000 54.000 60.000 68.000
[166] 69.000 63.000 75.000 70.000 69.000 63.000 64.000 65.000 70.000 67.000 75.000
[177] 62.000 71.000 68.000 66.000 70.000 74.000 67.000 64.000 68.000 64.000 61.000
[188] 79.000 63.000 64.000 71.000 61.000 NA NA 61.000 71.000 60.500 58.500
[199] 66.500 66.000 64.000 60.000 65.000 63.000 69.000 66.000 67.000 62.000 67.000
[210] 65.000 69.000 67.000 64.000 67.000 69.000 72.000 65.000 64.000 62.000 64.000
[221] 66.000 64.000 66.000 65.500 66.000 74.000 68.000 67.000 71.000 71.500 70.000
[232] 63.000 70.000 63.000 68.000 67.000 73.000 70.000 68.000 71.000 69.000 72.000
[243] 72.000 70.000 60.000 62.000 68.000 72.000 69.000 70.000 61.000 66.000 73.000
[254] 70.000 71.000 72.000 66.000 70.000 67.000 62.000 62.000 64.000 67.000 70.000
[265] 70.000 71.000 68.000 71.000 65.500 62.500 84.000 72.000 60.000 70.000 68.000
[276] 71.000 62.000 62.000 65.000 66.000 60.000 67.500 58.000 64.000 73.000 68.000
[287] 64.000 70.000 67.000 63.000 68.000 72.000 73.000 61.000 60.000 62.000 63.000
[298] 66.000 68.000 63.000 78.000 67.000 74.000 62.000 67.000 63.000 62.000 64.000
[309] 68.000 66.929 72.000 67.500 64.000 79.000 66.000 64.000 64.000 64.000 68.000
[320] 70.000 70.000 65.000 62.000 67.000 69.000 74.000 65.000 68.000 60.000 66.000
[331] 65.000 68.000 67.000 72.000 65.000 67.000 72.000 67.000 72.000 66.000 NA
[342] 73.000 71.000 71.000 72.000 66.000 69.000 72.000 65.000 67.000 65.000 65.000
[353] 62.000 71.000 63.000 65.000 63.000 67.000 69.000 72.000 68.000 60.000 62.000
[364] 65.000 70.000 66.000 64.000 70.000 67.000 66.000 67.000 62.000 64.000 62.000
[375] 63.000 64.000 64.000 61.000 64.000 62.000 67.000 65.000 66.000 72.000 64.000
[386] 70.000 67.000 63.000 75.000 74.000 67.000 62.000 72.000 65.000 69.000 70.000
[397] 64.000 66.000 60.500 66.000 72.000 72.000 64.000 65.000 62.000 64.000 65.000
[408] 68.000 73.000 71.000 62.000 62.000 62.000 63.000 70.000 71.000 64.000 64.000
[419] NA 74.000 64.000 60.000 77.000 58.000 61.000 66.000 72.000 70.000 69.000
[430] 65.000 69.500 72.000 63.000 67.000 69.000 73.000 70.500 60.000 70.000 60.000
[441] 68.500 60.000 59.000 64.000 66.000 68.000 66.000 61.000 74.000 62.000 64.000
[452] 66.000 62.000 67.000 68.000 61.500 70.000 66.000 64.000 67.000 66.000 62.000
[463] 62.000 73.000 64.000 67.500 65.000 65.000 59.000 69.500 65.000 71.000 62.000
[474] 63.000 72.000 61.000 65.000 60.000 64.000 67.000 65.000 63.000 61.000 60.500
[485] 63.000 65.000 68.000 64.000 72.000 65.000 62.000 68.000 64.000 62.000 65.000
[496] 62.000 70.000 56.000 72.000 71.000 71.000 74.000 63.000 68.000 60.000 69.500
[507] 69.000 70.000 70.000 67.000 75.000 65.000 66.000 72.000 64.000 73.000 71.000
[518] 62.000 67.000 65.000 65.000 68.000 66.000 75.000 69.000 66.500 63.000 65.000
[529] 78.000 62.000 70.000 60.000 70.000 64.000 63.000 64.000 65.000 63.000 74.000
[540] 72.000 76.000 70.000 65.000 68.000 69.000 73.000 63.000 62.000 66.000 71.000
[551] 64.000 62.000 67.000 67.000 64.000 63.000 62.000 68.000 60.000 69.000 70.000
[562] 67.000 67.000 66.000 70.000 72.000 67.500 70.000 74.000 63.000 62.000 64.000
[573] 69.000 64.000 75.500 68.000 74.000 64.000 68.000 67.000 69.000 63.000 66.000
[584] 61.000 62.000 NA 66.000 65.000 73.000 70.000 71.000 61.000 63.000 64.000
[595] 65.000 65.000 70.000 69.000 65.000 63.000 65.000 66.000 68.000 61.000 NA
[606] NA 71.750 NA 66.000 68.000 65.000 60.000 71.000 72.000 73.000 64.000
[617] 69.000 64.000 72.500 66.000 67.000 67.000 66.000 72.000 70.000 72.000 64.000
[628] 64.000 65.000 71.000 71.000 70.000 71.000 67.000 61.000 67.000 64.000 67.000
[639] 66.500 61.000 63.000 66.000 57.750 66.000 64.000 68.000 67.000 68.000 65.000
[650] 74.000 72.000 68.000 71.000 66.000 67.000 68.000 69.000
> male.Height <- Height[Gender == "male"]
> female.Height <- Height[Gender == "female"]
> male.Height
[1] 70.000 65.000 72.000 72.000 66.000 71.000 71.000 71.000 68.000 70.000 71.000
[12] 73.000 72.000 67.000 72.000 73.000 71.000 73.000 72.000 68.000 66.000 76.000
[23] 71.000 68.000 73.000 70.000 71.000 74.000 76.000 70.000 72.000 70.000 75.000
[34] 71.000 71.000 72.000 74.000 70.000 74.000 70.000 71.000 72.000 68.000 70.500
[45] 70.000 73.000 68.000 74.000 69.000 63.000 72.000 71.000 75.000 70.000 77.000
[56] 69.000 68.000 69.000 75.000 70.000 69.000 70.000 75.000 71.000 68.000 70.000
[67] 74.000 79.000 NA NA 69.000 69.000 72.000 65.000 62.000 66.000 74.000
[78] 68.000 67.000 71.000 71.500 70.000 70.000 73.000 70.000 68.000 71.000 72.000
[89] 72.000 70.000 72.000 70.000 73.000 72.000 70.000 67.000 70.000 71.000 68.000
[100] 71.000 72.000 70.000 68.000 71.000 62.000 68.000 70.000 72.000 73.000 61.000
[111] 67.000 74.000 66.929 72.000 79.000 66.000 68.000 70.000 69.000 74.000 68.000
[122] 68.000 67.000 72.000 67.000 72.000 72.000 66.000 NA 73.000 71.000 71.000
[133] 72.000 71.000 70.000 70.000 66.000 72.000 70.000 67.000 75.000 74.000 67.000
[144] 72.000 72.000 68.000 73.000 71.000 70.000 71.000 74.000 66.000 72.000 69.000
[155] 67.000 69.000 73.000 70.500 70.000 74.000 68.000 70.000 73.000 59.000 71.000
[166] 72.000 61.000 72.000 70.000 72.000 71.000 71.000 74.000 70.000 70.000 67.000
[177] 75.000 72.000 73.000 71.000 67.000 75.000 69.000 78.000 70.000 70.000 74.000
[188] 72.000 76.000 68.000 73.000 66.000 70.000 72.000 70.000 74.000 75.500 74.000
[199] 62.000 66.000 73.000 70.000 71.000 70.000 71.750 71.000 72.000 73.000 72.500
[210] 66.000 72.000 70.000 72.000 65.000 71.000 71.000 70.000 71.000 74.000 72.000
[221] 68.000 69.000
> mean(male.Height, na.rm=TRUE)
[1] 70.50767
> mean(female.Height, na.rm=TRUE)
[1] 64.75701
> diff.Height <- mean(male.Height, na.rm=TRUE) - mean(female.Height, na.rm=TRUE)
> diff.Height
[1] 5.750657
> plot(ToSleep)
> plot(ToSleep, WakeUp)
> fit <- lm(WakeUp ~ ToSleep)
> fit
Call:
lm(formula = WakeUp ~ ToSleep)
Coefficients:
(Intercept) ToSleep
7.9628 0.4247
> abline(fit)
> fit
Call:
lm(formula = WakeUp ~ ToSleep)
Coefficients:
(Intercept) ToSleep
7.9628 0.4247
> fit$(Intercept)
エラー: 予想外の ‘(‘ です in “fit$(”
> fit$Intercept
NULL
> fit$ToSleep
NULL
> ToSleep
[1] -2.5 1.5 -1.5 2.0 0.0 1.0 1.5 0.5 -0.5 2.5 0.0 -1.0 2.5 -1.0 2.5
[16] -0.5 0.0 2.5 0.5 -1.5 1.5 1.5 1.0 2.0 0.0 -0.5 0.5 1.5 0.5 1.5
[31] 3.0 1.5 2.0 1.0 0.5 1.0 0.5 2.0 1.5 -0.5 2.0 -0.5 0.5 -1.0 -1.0
[46] 1.0 2.5 1.0 2.0 -0.5 1.5 -0.5 2.5 2.0 1.5 0.0 0.5 4.0 0.5 0.0
[61] -1.0 0.5 3.0 0.0 0.5 -1.0 1.5 1.5 0.0 2.0 2.5 3.0 1.5 -0.5 0.5
[76] 3.0 -1.0 2.5 -0.5 3.5 1.5 4.5 1.5 3.5 2.5 0.5 1.5 1.5 3.5 1.5
[91] 0.5 -1.0 0.5 2.0 0.0 2.0 2.0 0.0 0.5 1.5 1.0 0.0 1.5 3.0 0.0
[106] 1.0 1.5 5.0 0.5 1.0 2.5 0.0 -1.0 0.0 -0.5 -1.0 0.5 1.0 1.0 1.0
[121] -0.5 0.5 0.5 2.0 1.5 0.0 0.5 0.5 1.0 NA -0.5 0.5 3.5 1.0 0.0
[136] 1.5 3.5 0.5 -2.0 1.5 0.5 -1.0 2.0 1.5 -0.5 1.5 0.0 1.5 1.0 0.5
[151] 0.0 1.0 1.0 -0.5 -1.0 1.5 0.0 -1.0 3.5 2.5 1.5 1.5 -0.5 0.5 1.0
[166] 0.0 2.0 1.0 0.5 0.0 -0.5 0.5 -0.5 0.5 -0.5 -2.0 -0.5 2.5 -0.5 -0.5
[181] -0.5 -0.5 -1.0 0.5 0.5 1.5 2.0 1.0 1.5 1.5 2.0 -0.5 0.0 2.0 -0.5
[196] -1.5 1.5 -0.5 2.5 2.0 3.5 1.5 -0.5 1.5 0.0 0.5 0.5 -0.5 2.0 2.5
[211] 1.5 0.5 1.0 1.5 2.0 1.5 1.5 0.3 2.5 1.5 1.5 -0.5 0.0 -0.5 1.0
[226] 1.5 1.5 1.5 2.5 2.5 3.0 1.0 0.5 5.0 1.0 3.5 0.0 1.0 -1.0 1.0
[241] -0.5 1.5 2.5 2.0 3.0 1.5 -1.0 2.5 0.5 0.0 0.5 2.5 0.5 1.0 2.5
[256] 1.5 3.0 3.5 3.5 0.0 1.5 1.5 1.0 1.5 2.0 4.0 4.0 1.5 1.0 -0.5
[271] 2.5 3.5 2.5 2.5 2.5 0.5 -2.5 3.5 3.0 2.5 0.0 0.0 1.5 1.5 2.0
[286] 2.0 0.5 -0.5 0.5 2.0 0.5 0.0 -0.5 -0.5 -0.5 -0.5 0.5 -0.5 1.0 -0.5
[301] 0.5 3.5 -1.0 0.0 1.0 -1.5 0.5 0.5 0.5 NA 2.5 2.0 -0.5 0.0 1.0
[316] 1.0 0.5 0.0 2.0 0.0 -1.5 3.5 -0.5 0.0 2.0 -0.5 3.5 -0.5 -1.5 3.0
[331] 3.5 2.5 2.5 0.5 0.5 0.5 1.0 0.0 1.5 1.5 5.5 1.5 5.0 0.0 0.0
[346] -0.5 -2.0 2.5 0.5 2.5 0.5 -0.5 1.5 -0.5 0.5 1.0 1.5 0.5 2.0 2.0
[361] 0.0 1.0 2.0 -1.0 0.0 0.0 1.5 1.0 -0.5 1.5 1.0 1.0 -1.0 4.0 -0.5
[376] 0.5 -0.5 0.0 1.5 -0.5 1.5 2.5 2.5 0.0 1.0 2.0 0.5 0.0 -1.0 2.0
[391] 1.0 0.5 -1.5 4.0 1.5 1.5 2.5 -0.5 1.5 1.0 4.0 1.5 0.0 -0.5 2.0
[406] -0.5 2.5 1.5 3.0 2.5 1.5 1.5 -0.5 0.0 -2.0 4.5 3.0 3.0 0.0 2.0
[421] 1.0 0.5 2.0 -1.0 4.5 2.0 2.5 1.5 2.5 2.5 1.5 2.0 1.5 0.5 -0.5
[436] -0.5 2.0 2.0 0.5 2.0 0.0 -1.0 -1.0 -0.5 -1.5 1.0 0.0 0.5 1.0 2.5
[451] 0.5 0.0 1.0 2.0 -1.5 3.0 -0.5 0.0 0.5 0.5 -1.5 0.0 -0.5 3.5 -1.5
[466] -1.0 1.5 1.5 0.5 0.0 -0.5 0.0 0.5 0.5 1.0 -0.5 0.0 0.5 1.0 0.0
[481] -0.5 1.5 4.0 1.5 -0.5 1.0 1.5 -0.5 1.0 -0.5 1.0 1.5 0.5 1.5 0.0
[496] 1.5 1.5 1.5 0.5 1.0 1.0 4.0 2.5 2.5 0.0 0.5 0.0 0.0 1.5 1.5
[511] 1.0 2.5 0.5 -2.0 1.0 1.0 1.5 0.5 1.0 2.5 -1.0 2.5 1.0 3.5 -0.5
[526] 0.0 0.5 2.0 -2.0 -1.0 2.0 2.5 0.0 0.5 0.3 -0.5 1.5 1.0 1.5 4.5
[541] 5.5 0.0 1.5 1.0 -0.5 2.0 0.0 NA 0.0 1.0 1.0 1.5 -0.5 0.0 -1.5
[556] 3.0 -0.5 2.5 6.0 2.0 1.5 1.5 1.0 3.5 1.5 3.5 2.0 0.0 0.0 -0.5
[571] 2.5 3.5 2.5 -0.5 1.5 1.5 0.0 2.0 1.5 -0.5 2.5 -0.5 1.0 1.0 -1.5
[586] -0.5 0.5 1.5 0.0 0.5 1.0 1.0 3.0 2.5 4.0 1.5 4.5 2.0 0.5 1.5
[601] 0.0 2.0 -0.5 0.0 0.5 3.0 1.0 2.5 0.5 0.0 0.0 1.0 2.0 1.0 1.0
[616] -0.5 0.5 1.0 0.5 2.0 -2.0 2.5 0.5 2.0 3.0 2.5 1.0 2.0 3.0 1.5
[631] -0.5 1.5 0.5 2.0 0.5 -1.0 0.5 4.0 2.5 0.0 1.5 -1.0 0.0 0.5 1.5
[646] 2.0 0.0 -0.5 4.5 1.5 3.5 0.5 -1.0 -1.5 0.0 2.5 3.5
> $ToSleep
エラー: 予想外の ‘$’ です in “$”
> fit$coefficients
(Intercept) ToSleep
7.9627644 0.4247176
> fit$coefficients[“ToSleep”]
ToSleep
0.4247176
> fit$coefficients[“ToSleep”]*0+fit$coefficients[“Intercept”]
ToSleep
NA
> fit$coefficients[“Intercept”]
NA
> fit$coefficients[“(Intercept)”]
(Intercept)
7.962764
> fit$coefficients[“ToSleep”]*0+fit$coefficients[“(Intercept)”]
ToSleep
7.962764
>
> binomial.conf.interval<- function(y,n)
+ { z <- qnorm(.95)}
>
> binomial.conf.interval<- function(y,n)
+ { z <- qnorm(.95) +
+ phat <- y/n +
+ se <- sqrt(phat * (1 - phat)/n) +
+ return(c(phat - z * se, phat + z * se)) +
+ }
エラー: 予想外の '}' です in:
"return(c(phat - z * se, phat + z * se)) +
}"
> binomial.conf.interval<- function(y,n)
+ { z <- qnorm(.95)
+ phat <- y/n
+ se <- sqrt(phat * (1 - phat)/n)
+ return(c(phat - z * se, phat + z * se))
+ }
> ?rbinom
> y <- rbinom(20, 1, 0.5)
> y
[1] 1 1 0 1 0 1 1 1 0 0 0 1 0 1 1 0 1 0 1 0
> y_90 <- binomial.conf.interval(y,20)
> y_90
[1] -0.03016025 -0.03016025 0.00000000 -0.03016025 0.00000000 -0.03016025
[7] -0.03016025 -0.03016025 0.00000000 0.00000000 0.00000000 -0.03016025
[13] 0.00000000 -0.03016025 -0.03016025 0.00000000 -0.03016025 0.00000000
[19] -0.03016025 0.00000000 0.13016025 0.13016025 0.00000000 0.13016025
[25] 0.00000000 0.13016025 0.13016025 0.13016025 0.00000000 0.00000000
[31] 0.00000000 0.13016025 0.00000000 0.13016025 0.13016025 0.00000000
[37] 0.13016025 0.00000000 0.13016025 0.00000000
> plot(y_90)
> hist(y)
> hist(y_90)
> y <- rbinom(20, 1, 0.5)
> y_90 <- binomial.conf.interval(y,20)
> y_90
[1] -0.03016025 0.00000000 -0.03016025 -0.03016025 0.00000000 0.00000000
[7] 0.00000000 0.00000000 -0.03016025 -0.03016025 0.00000000 0.00000000
[13] -0.03016025 0.00000000 0.00000000 0.00000000 0.00000000 0.00000000
[19] -0.03016025 0.00000000 0.13016025 0.00000000 0.13016025 0.13016025
[25] 0.00000000 0.00000000 0.00000000 0.00000000 0.13016025 0.13016025
[31] 0.00000000 0.00000000 0.13016025 0.00000000 0.00000000 0.00000000
[37] 0.00000000 0.00000000 0.13016025 0.00000000
> y <- rbinom(20, 20, 0.5)
> y_90 <- binomial.conf.interval(y,20)
> y_90
[1] 0.1745704 0.3160998 0.2670216 0.2670216 0.4745704 0.2670216 0.4198153
[8] 0.2670216 0.2198153 0.1745704 0.2670216 0.4198153 0.3160998 0.4198153
[15] 0.4745704 0.2670216 0.4745704 0.3670216 0.3160998 0.5314527 0.5254296
[22] 0.6839002 0.6329784 0.6329784 0.8254296 0.6329784 0.7801847 0.6329784
[29] 0.5801847 0.5254296 0.6329784 0.7801847 0.6839002 0.7801847 0.8254296
[36] 0.6329784 0.8254296 0.7329784 0.6839002 0.8685473
> hist(y_90)
> plot(y_90)
> y <- rbinom(20, 1, 0.5)
> y
[1] 1 0 1 1 0 0 0 1 0 1 0 1 1 0 0 1 0 0 1 1
> y_90 <- binomial.conf.interval(y,20)
> y_90
[1] -0.03016025 0.00000000 -0.03016025 -0.03016025 0.00000000 0.00000000
[7] 0.00000000 -0.03016025 0.00000000 -0.03016025 0.00000000 -0.03016025
[13] -0.03016025 0.00000000 0.00000000 -0.03016025 0.00000000 0.00000000
[19] -0.03016025 -0.03016025 0.13016025 0.00000000 0.13016025 0.13016025
[25] 0.00000000 0.00000000 0.00000000 0.13016025 0.00000000 0.13016025
[31] 0.00000000 0.13016025 0.13016025 0.00000000 0.00000000 0.13016025
[37] 0.00000000 0.00000000 0.13016025 0.13016025
> y_90 <- binomial.conf.interval(y,1)
> y_90
[1] 1 0 1 1 0 0 0 1 0 1 0 1 1 0 0 1 0 0 1 1 1 0 1 1 0 0 0 1 0 1 0 1 1 0 0 1 0 0 1
[40] 1
> y_90 <- binomial.conf.interval(y,2)
> y_90
[1] -0.08154358 0.00000000 -0.08154358 -0.08154358 0.00000000 0.00000000
[7] 0.00000000 -0.08154358 0.00000000 -0.08154358 0.00000000 -0.08154358
[13] -0.08154358 0.00000000 0.00000000 -0.08154358 0.00000000 0.00000000
[19] -0.08154358 -0.08154358 1.08154358 0.00000000 1.08154358 1.08154358
[25] 0.00000000 0.00000000 0.00000000 1.08154358 0.00000000 1.08154358
[31] 0.00000000 1.08154358 1.08154358 0.00000000 0.00000000 1.08154358
[37] 0.00000000 0.00000000 1.08154358 1.08154358
> y_90 <- binomial.conf.interval(y,20)
> y_90
[1] -0.03016025 0.00000000 -0.03016025 -0.03016025 0.00000000 0.00000000
[7] 0.00000000 -0.03016025 0.00000000 -0.03016025 0.00000000 -0.03016025
[13] -0.03016025 0.00000000 0.00000000 -0.03016025 0.00000000 0.00000000
[19] -0.03016025 -0.03016025 0.13016025 0.00000000 0.13016025 0.13016025
[25] 0.00000000 0.00000000 0.00000000 0.13016025 0.00000000 0.13016025
[31] 0.00000000 0.13016025 0.13016025 0.00000000 0.00000000 0.13016025
[37] 0.00000000 0.00000000 0.13016025 0.13016025
> y <- rbinom(0:20, 20, 0.5)
> y
[1] 8 5 13 12 14 9 11 11 14 12 8 10 10 8 11 14 4 8 10 10 9
> y <- rbinom(20, 1, 0.5)
> y
[1] 1 0 1 1 0 0 1 0 1 1 1 1 0 1 1 0 0 1 1 1
> y_90 <- binomial.conf.interval(y,20)
> y_90
[1] -0.03016025 0.00000000 -0.03016025 -0.03016025 0.00000000 0.00000000
[7] -0.03016025 0.00000000 -0.03016025 -0.03016025 -0.03016025 -0.03016025
[13] 0.00000000 -0.03016025 -0.03016025 0.00000000 0.00000000 -0.03016025
[19] -0.03016025 -0.03016025 0.13016025 0.00000000 0.13016025 0.13016025
[25] 0.00000000 0.00000000 0.13016025 0.00000000 0.13016025 0.13016025
[31] 0.13016025 0.13016025 0.00000000 0.13016025 0.13016025 0.00000000
[37] 0.00000000 0.13016025 0.13016025 0.13016025
> y_90 <- binomial.conf.interval(y,1)
> y_90
[1] 1 0 1 1 0 0 1 0 1 1 1 1 0 1 1 0 0 1 1 1 1 0 1 1 0 0 1 0 1 1 1 1 0 1 1 0 0 1 1
[40] 1
> y_90 <- binomial.conf.interval(y,20)
> y_90
[1] -0.03016025 0.00000000 -0.03016025 -0.03016025 0.00000000 0.00000000
[7] -0.03016025 0.00000000 -0.03016025 -0.03016025 -0.03016025 -0.03016025
[13] 0.00000000 -0.03016025 -0.03016025 0.00000000 0.00000000 -0.03016025
[19] -0.03016025 -0.03016025 0.13016025 0.00000000 0.13016025 0.13016025
[25] 0.00000000 0.00000000 0.13016025 0.00000000 0.13016025 0.13016025
[31] 0.13016025 0.13016025 0.00000000 0.13016025 0.13016025 0.00000000
[37] 0.00000000 0.13016025 0.13016025 0.13016025
> binomial.conf.interval<- function(y,n)
+ { z <- qnorm(.90)
+ phat <- y/n
+ se <- sqrt(phat * (1 - phat)/n)
+ return(c(phat - z * se, phat + z * se))
+ }
> y <- rbinom(20, 1, 0.5)
> y_90 <- binomial.conf.interval(y,20)
> y_90
[1] -0.0124551 -0.0124551 -0.0124551 0.0000000 0.0000000 0.0000000 0.0000000
[8] -0.0124551 0.0000000 -0.0124551 0.0000000 -0.0124551 -0.0124551 -0.0124551
[15] -0.0124551 -0.0124551 -0.0124551 0.0000000 -0.0124551 0.0000000 0.1124551
[22] 0.1124551 0.1124551 0.0000000 0.0000000 0.0000000 0.0000000 0.1124551
[29] 0.0000000 0.1124551 0.0000000 0.1124551 0.1124551 0.1124551 0.1124551
[36] 0.1124551 0.1124551 0.0000000 0.1124551 0.0000000
> ?rbinom
> y <- rbinom(1, 20, 0.5)
> y
[1] 13
> y_90 <- binomial.conf.interval(y,20)
> y_90
[1] 0.5133179 0.7866821
> y <- rbinom(1, 20, 0.5)
> y
[1] 7
> y_90 <- binomial.conf.interval(y,20)
> y_90
[1] 0.2133179 0.4866821
> y <- rbinom(20, 20, 0.5)
> y
[1] 15 12 14 12 12 11 9 12 10 11 9 9 14 11 9 9 10 6 11 10
> y_90 <- binomial.conf.interval(y,20)
> y_90
[1] 0.6259143 0.4596131 0.5686800 0.4596131 0.4596131 0.4074364 0.3074364
[8] 0.4596131 0.3567182 0.4074364 0.3074364 0.3074364 0.5686800 0.4074364
[15] 0.3074364 0.3074364 0.3567182 0.1686800 0.4074364 0.3567182 0.8740857
[22] 0.7403869 0.8313200 0.7403869 0.7403869 0.6925636 0.5925636 0.7403869
[29] 0.6432818 0.6925636 0.5925636 0.5925636 0.8313200 0.6925636 0.5925636
[36] 0.5925636 0.6432818 0.4313200 0.6925636 0.6432818
> y_90_low <- y_90[1.10]
> y_90_low
[1] 0.6259143
> y_90_low <- y_90[1:10]
> y_90_low
[1] 0.6259143 0.4596131 0.5686800 0.4596131 0.4596131 0.4074364 0.3074364
[8] 0.4596131 0.3567182 0.4074364
> mean(y_90_low)
[1] 0.4512074
> y_90_high <- y_90[11:20]
> y_90_high
[1] 0.3074364 0.3074364 0.5686800 0.4074364 0.3074364 0.3074364 0.3567182
[8] 0.1686800 0.4074364 0.3567182
> mean(y_90_high)
[1] 0.3495415
> y_90_low <- y_90[1:20]
> mean(y_90_low)
[1] 0.4003744
> y_90_high <- y_90[21:40]
> mean(y_90_high)
[1] 0.6796256
> y <- rbinom(120, 20, 0.05)
> y
[1] 1 0 0 0 0 1 2 0 1 0 3 0 1 0 1 1 1 1 1 1 3 0 1 2 1 2 2 2 0 0 1 3 0 1 1 0 0 0
[39] 0 0 2 0 1 1 1 0 1 2 1 0 2 2 2 1 2 1 1 1 1 0 0 2 2 1 1 0 1 3 0 0 1 1 0 0 3 0
[77] 2 0 1 1 2 0 0 0 1 0 0 3 0 3 2 1 0 3 0 1 0 0 2 0 0 1 1 0 1 1 0 1 0 2 1 1 1 1
[115] 1 4 1 1 0 3
> y_90 <- binomial.conf.interval(y,20)
> y_90
[1] -0.01245510 0.00000000 0.00000000 0.00000000 0.00000000 -0.01245510
[7] 0.01403091 0.00000000 -0.01245510 0.00000000 0.04767631 0.00000000
[13] -0.01245510 0.00000000 -0.01245510 -0.01245510 -0.01245510 -0.01245510
[19] -0.01245510 -0.01245510 0.04767631 0.00000000 -0.01245510 0.01403091
[25] -0.01245510 0.01403091 0.01403091 0.01403091 0.00000000 0.00000000
[31] -0.01245510 0.04767631 0.00000000 -0.01245510 -0.01245510 0.00000000
[37] 0.00000000 0.00000000 0.00000000 0.00000000 0.01403091 0.00000000
[43] -0.01245510 -0.01245510 -0.01245510 0.00000000 -0.01245510 0.01403091
[49] -0.01245510 0.00000000 0.01403091 0.01403091 0.01403091 -0.01245510
[55] 0.01403091 -0.01245510 -0.01245510 -0.01245510 -0.01245510 0.00000000
[61] 0.00000000 0.01403091 0.01403091 -0.01245510 -0.01245510 0.00000000
[67] -0.01245510 0.04767631 0.00000000 0.00000000 -0.01245510 -0.01245510
[73] 0.00000000 0.00000000 0.04767631 0.00000000 0.01403091 0.00000000
[79] -0.01245510 -0.01245510 0.01403091 0.00000000 0.00000000 0.00000000
[85] -0.01245510 0.00000000 0.00000000 0.04767631 0.00000000 0.04767631
[91] 0.01403091 -0.01245510 0.00000000 0.04767631 0.00000000 -0.01245510
[97] 0.00000000 0.00000000 0.01403091 0.00000000 0.00000000 -0.01245510
[103] -0.01245510 0.00000000 -0.01245510 -0.01245510 0.00000000 -0.01245510
[109] 0.00000000 0.01403091 -0.01245510 -0.01245510 -0.01245510 -0.01245510
[115] -0.01245510 0.08537454 -0.01245510 -0.01245510 0.00000000 0.04767631
[121] 0.11245510 0.00000000 0.00000000 0.00000000 0.00000000 0.11245510
[127] 0.18596909 0.00000000 0.11245510 0.00000000 0.25232369 0.00000000
[133] 0.11245510 0.00000000 0.11245510 0.11245510 0.11245510 0.11245510
[139] 0.11245510 0.11245510 0.25232369 0.00000000 0.11245510 0.18596909
[145] 0.11245510 0.18596909 0.18596909 0.18596909 0.00000000 0.00000000
[151] 0.11245510 0.25232369 0.00000000 0.11245510 0.11245510 0.00000000
[157] 0.00000000 0.00000000 0.00000000 0.00000000 0.18596909 0.00000000
[163] 0.11245510 0.11245510 0.11245510 0.00000000 0.11245510 0.18596909
[169] 0.11245510 0.00000000 0.18596909 0.18596909 0.18596909 0.11245510
[175] 0.18596909 0.11245510 0.11245510 0.11245510 0.11245510 0.00000000
[181] 0.00000000 0.18596909 0.18596909 0.11245510 0.11245510 0.00000000
[187] 0.11245510 0.25232369 0.00000000 0.00000000 0.11245510 0.11245510
[193] 0.00000000 0.00000000 0.25232369 0.00000000 0.18596909 0.00000000
[199] 0.11245510 0.11245510 0.18596909 0.00000000 0.00000000 0.00000000
[205] 0.11245510 0.00000000 0.00000000 0.25232369 0.00000000 0.25232369
[211] 0.18596909 0.11245510 0.00000000 0.25232369 0.00000000 0.11245510
[217] 0.00000000 0.00000000 0.18596909 0.00000000 0.00000000 0.11245510
[223] 0.11245510 0.00000000 0.11245510 0.11245510 0.00000000 0.11245510
[229] 0.00000000 0.18596909 0.11245510 0.11245510 0.11245510 0.11245510
[235] 0.11245510 0.31462546 0.11245510 0.11245510 0.00000000 0.25232369
> y <- rbinom(20, 20, 0.05)
> y
[1] 0 0 0 1 0 0 1 0 2 2 1 2 1 0 0 2 2 3 0 0
> y_90 <- binomial.conf.interval(y,20)
> y_90
[1] 0.00000000 0.00000000 0.00000000 -0.01245510 0.00000000 0.00000000
[7] -0.01245510 0.00000000 0.01403091 0.01403091 -0.01245510 0.01403091
[13] -0.01245510 0.00000000 0.00000000 0.01403091 0.01403091 0.04767631
[19] 0.00000000 0.00000000 0.00000000 0.00000000 0.00000000 0.11245510
[25] 0.00000000 0.00000000 0.11245510 0.00000000 0.18596909 0.18596909
[31] 0.11245510 0.18596909 0.11245510 0.00000000 0.00000000 0.18596909
[37] 0.18596909 0.25232369 0.00000000 0.00000000
> y_90_low <- y_90[1:20]
> y_90_high <- y_90[21:40]
> mean(y_90_low)
[1] 0.003400523
> mean(y_90_high)
[1] 0.08159948
> y <- rbinom(20*20, 20, 0.05)
> y
[1] 0 0 1 1 1 1 0 2 1 3 1 1 1 1 3 1 2 2 1 0 1 0 1 2 1 1 1 4 0 0 3 2 1 1 1 0 0 1
[39] 1 2 0 1 1 1 1 0 1 1 1 0 1 1 1 1 0 1 1 1 1 0 1 1 0 0 1 2 1 1 0 1 3 1 1 3 0 2
[77] 1 0 1 1 2 0 2 1 0 1 1 0 1 2 0 3 0 2 3 2 0 0 2 1 3 1 0 1 0 0 0 0 2 1 1 3 0 1
[115] 1 3 0 1 1 1 1 0 0 0 2 0 1 0 0 0 0 0 1 0 2 1 0 1 2 1 0 1 0 0 3 3 3 1 0 0 2 2
[153] 1 0 2 0 1 1 1 1 1 0 0 0 0 1 1 1 1 2 2 1 1 0 2 1 0 0 0 2 0 1 0 1 2 0 0 2 0 1
[191] 2 1 2 2 3 1 2 0 0 1 2 1 2 2 3 0 1 1 0 3 1 3 0 1 1 0 0 2 2 3 0 0 0 1 0 1 2 2
[229] 2 3 1 1 0 2 1 0 0 3 0 1 0 1 2 1 0 1 1 1 0 1 1 2 0 2 0 0 1 1 1 0 2 1 1 0 1 2
[267] 0 0 0 1 0 0 1 0 0 0 1 1 2 1 5 1 0 0 3 1 2 0 1 1 2 1 2 1 1 1 1 1 2 2 0 5 1 1
[305] 1 1 0 1 1 0 0 1 0 1 1 2 1 0 1 0 0 1 1 2 1 0 1 2 1 1 0 1 1 1 1 0 1 0 1 0 0 1
[343] 1 1 2 4 0 1 1 2 2 0 3 0 0 1 0 0 0 1 3 1 0 1 1 3 0 2 0 0 1 1 0 2 2 2 3 2 0 1
[381] 0 2 2 0 0 3 1 0 3 1 2 0 0 2 2 2 1 0 1 1
> y <- rbinom(1, 20*20, 0.05)
> y
[1] 32
> y <- rbinom(1, 20, 0.05)
> y
[1] 1
> y <- rbinom(1, 20, 0.5)
> y
[1] 9
> test <- replicate(20, y)
> test
[1] 9 9 9 9 9 9 9 9 9 9 9 9 9 9 9 9 9 9 9 9
> test <- replicate(20, y)
> test
[1] 9 9 9 9 9 9 9 9 9 9 9 9 9 9 9 9 9 9 9 9
> test <- replicate(20, rbinom(1, 20, 0.5))
> test
[1] 14 12 11 9 8 8 7 7 10 15 5 15 9 8 9 9 13 12 7 10
> y_90 <- binomial.conf.interval(test,20)
> y_90
[1] 0.5686800 0.4596131 0.4074364 0.3074364 0.2596131 0.2596131 0.2133179
[8] 0.2133179 0.3567182 0.6259143 0.1259143 0.6259143 0.3074364 0.2596131
[15] 0.3074364 0.3074364 0.5133179 0.4596131 0.2133179 0.3567182 0.8313200
[22] 0.7403869 0.6925636 0.5925636 0.5403869 0.5403869 0.4866821 0.4866821
[29] 0.6432818 0.8740857 0.3740857 0.8740857 0.5925636 0.5403869 0.5925636
[36] 0.5925636 0.7866821 0.7403869 0.4866821 0.6432818
> plot(density(test))
> y_90 <- binomial.conf.interval(test,1)
警告メッセージ:
sqrt(phat * (1 - phat)/n) で: 計算結果が NaN になりました
> y_90 <- binomial.conf.interval(test,20)
> y_90
[1] 0.5686800 0.4596131 0.4074364 0.3074364 0.2596131 0.2596131 0.2133179
[8] 0.2133179 0.3567182 0.6259143 0.1259143 0.6259143 0.3074364 0.2596131
[15] 0.3074364 0.3074364 0.5133179 0.4596131 0.2133179 0.3567182 0.8313200
[22] 0.7403869 0.6925636 0.5925636 0.5403869 0.5403869 0.4866821 0.4866821
[29] 0.6432818 0.8740857 0.3740857 0.8740857 0.5925636 0.5403869 0.5925636
[36] 0.5925636 0.7866821 0.7403869 0.4866821 0.6432818
> test <- replicate(20, rbinom(1, 20, 0.05))
> test
[1] 0 1 1 2 0 0 0 0 1 0 0 2 0 0 2 2 1 1 2 4
> plot(density(test))
> plot(density(test), xlim=c(-1, 10))
> plot(density(test), xlim=c(-2, 10))
> y_90 <- binomial.conf.interval(test,1)
警告メッセージ:
sqrt(phat * (1 - phat)/n) で: 計算結果が NaN になりました
> y_90 <- binomial.conf.interval(test,20)
> y_90
[1] 0.00000000 -0.01245510 -0.01245510 0.01403091 0.00000000 0.00000000
[7] 0.00000000 0.00000000 -0.01245510 0.00000000 0.00000000 0.01403091
[13] 0.00000000 0.00000000 0.01403091 0.01403091 -0.01245510 -0.01245510
[19] 0.01403091 0.08537454 0.00000000 0.11245510 0.11245510 0.18596909
[25] 0.00000000 0.00000000 0.00000000 0.00000000 0.11245510 0.00000000
[31] 0.00000000 0.18596909 0.00000000 0.00000000 0.18596909 0.18596909
[37] 0.11245510 0.11245510 0.18596909 0.31462546
> y <- rbinom(1, 20, 0.5)
> y
[1] 13
> y_90 <- binomial.conf.interval(y,20)
> y_90
[1] 0.5133179 0.7866821
> y_90 <- binomial.conf.interval(y,2)
警告メッセージ:
sqrt(phat * (1 - phat)/n) で: 計算結果が NaN になりました
> y_90 <- binomial.conf.interval(y,10)
警告メッセージ:
sqrt(phat * (1 - phat)/n) で: 計算結果が NaN になりました
> y_90 <- binomial.conf.interval(y,20)
> y_90
[1] 0.5133179 0.7866821
> test <- replicate(20, rbinom(1, 20, 0.5))
> plot(density(test), xlim=c(-2, 10))
> plot(density(test), xlim=c(-2, 20))
> test
[1] 12 11 9 7 9 10 7 8 9 15 9 12 10 13 9 12 11 11 7 11
> test <- rbinom(1, 10, 0.05)
> test
[1] 2
> test <- replicate(1000, rbinom(1, 20, 0.05))
> plot(density(test), xlim=c(-2, 20))
> test <- replicate(1000, rbinom(1, 100, 0.25))
> plot(density(test), xlim=c(-2, 100))
> test <- replicate(1000, rbinom(1, 100, 0.5))
> plot(density(test), xlim=c(-2, 100))
> test <- replicate(1000, rbinom(1, 100, 0.25))
> plot(density(test), xlim=c(-2, 100))
> test <- replicate(1000, rbinom(1, 100, 0.05))
> plot(density(test), xlim=c(-2, 100))
> test <- replicate(1000, rbinom(1, 100, 0.5))
> plot(density(test), xlim=c(-2, 100))
> test <- replicate(1000, rbinom(1, 10, 0.05))
> plot(density(test), xlim=c(-2, 10))
> ?rbinom
> test <- pbinom(1, 10, 0.5)
> test
[1] 0.01074219
> test <- replicate(1000, rbinom(1, 100, 0.5))
> quantile(test, c(0.05, 0.95))
5% 95%
41 58
> test <- replicate(1000, rbinom(1, 100, 0.05))
> quantile(test, c(0.05, 0.95))
5% 95%
2 9
> sim_func <- function(n,p,m)
+ {
+ test <- replicate(m, rbinom(1, n, p))
+ y_90 <- binomial.conf.interval(test,n)
+ plot(density(test), xlim=c(-2, m))
+ return(y_90)
+ }
> sim_func(20, 0,5, 20)
sim_func(20, 0, 5, 20) でエラー: 使われていない引数 (20)
> sim_func(20, 0.5, 20)
[1] 0.3567182 0.3567182 0.3074364 0.1686800 0.5686800 0.2133179 0.3074364
[8] 0.5133179 0.5133179 0.4074364 0.4596131 0.5133179 0.2596131 0.3074364
[15] 0.5133179 0.3567182 0.4074364 0.3567182 0.2596131 0.5686800 0.6432818
[22] 0.6432818 0.5925636 0.4313200 0.8313200 0.4866821 0.5925636 0.7866821
[29] 0.7866821 0.6925636 0.7403869 0.7866821 0.5403869 0.5925636 0.7866821
[36] 0.6432818 0.6925636 0.6432818 0.5403869 0.8313200
> sim_func <- function(n,p,m)
+ {
+ test <- replicate(m, rbinom(1, n, p))
+ y_90 <- binomial.conf.interval(test,n)
+ plot(density(test), xlim=c(-2, m))
+ quantile(test, c(0.05, 0.95))
+ return(y_90)
+ }
> sim_func(20, 0.5, 20)
[1] 0.1686800 0.4596131 0.5133179 0.3074364 0.3074364 0.3567182 0.4074364
[8] 0.3567182 0.5686800 0.2596131 0.3567182 0.3074364 0.3567182 0.3567182
[15] 0.3567182 0.4596131 0.3074364 0.5686800 0.3567182 0.5686800 0.4313200
[22] 0.7403869 0.7866821 0.5925636 0.5925636 0.6432818 0.6925636 0.6432818
[29] 0.8313200 0.5403869 0.6432818 0.5925636 0.6432818 0.6432818 0.6432818
[36] 0.7403869 0.5925636 0.8313200 0.6432818 0.8313200
> sim_func <- function(n,p,m)
+ {
+ test <- replicate(m, rbinom(1, n, p))
+ y_90 <- binomial.conf.interval(test,n)
+ plot(density(test), xlim=c(-2, m))
+
+ return(quantile(test, c(0.05, 0.95)), y_90)
+ }
> sim_func(20, 0.5, 20)
return(quantile(test, c(0.05, 0.95)), y_90) でエラー:
複数の結果を返す return は許されません
> jpn <- readShapePoly("JPN_adm1.shp") # シェープファイルはカレントディレクトにあるとします
readShapePoly("JPN_adm1.shp") でエラー:
関数 "readShapePoly" を見つけることができませんでした
> jpndata <- read.dbf("JPN_adm1.dbf") # dbfファイルの読み込み
read.dbf("JPN_adm1.dbf") でエラー:
関数 "read.dbf" を見つけることができませんでした
>
> library(maptools)
Checking rgeos availability: TRUE
> library(spsurvey)
Version 3.3 of the spsurvey package was loaded successfully.
> library(ggplot2)
> library(RColorBrewer)
> library(readr)
> library(classInt)
>
> jpn <- readShapePoly("JPN_adm1.shp") # シェープファイルはカレントディレクトにあるとします
警告メッセージ:
use rgdal::readOGR or sf::st_read
> jpndata <- read.dbf("JPN_adm1.dbf") # dbfファイルの読み込み
>
> xlim <- c(126, 146) # 経度
> ylim <- c(26, 46) # 緯度
>
> stat2 <- read_csv("stat2_2017.csv")
Parsed with column specification:
cols(
番号 = col_integer(),
都道府県 = col_character(),
人口千人2015 = col_integer(),
病院数2012 = col_integer(),
一般病床数2012 = col_integer(),
大学医学部数2010 = col_integer(),
総医師数2014 = col_integer(),
現役医師数2014 = col_integer(),
女性医師数2014 = col_integer(),
女性医師比率2014 = col_double(),
外科医師数2014 = col_integer(),
若手医師数2014 = col_integer(),
研修医師数2014 = col_integer(),
麻酔科医師数2014 = col_integer(),
麻酔科医師比率2014 = col_double()
)
>
> jpndata2 <- merge(jpndata, stat2, sort=F, by.x="NL_NAME_1", by.y="都道府県")
> jpndata3 <- merge(jpndata2, stat1, sort=F, by.x="NL_NAME_1", by.y="都道府県")
>
> plotvar <- jpndata3$総採用数2018/jpndata3$人口千人2015
> nclr <- 8
> plotclr <- brewer.pal(nclr,"BuPu")
> class <- classIntervals(plotvar, nclr, style="quantile")
> colcode <- findColours(class, plotclr)
> par(family=”HiraKakuProN-W3″)
>
> plot(jpn, xlim=c(126, 146), ylim=c(26, 46))
> plot(jpn, col=colcode, add=T)
> title(main=”麻酔科領域専攻医:総採用数2018/人口千人2015″, sub=”Quantile (Equal-Frequency) Class Intervals”)
> legend(“bottomright”, legend=names(attr(colcode, “table”)), fill=attr(colcode, “palette”), cex=0.6, bty=”n”)
>
> plotvar <- jpndata3$総採用数2018/jpndata3$麻酔科医師数2014
> nclr <- 8
> plotclr <- brewer.pal(nclr,"BuPu")
> class <- classIntervals(plotvar, nclr, style="quantile")
> colcode <- findColours(class, plotclr)
> par(family=”HiraKakuProN-W3″)
>
> plot(jpn, xlim=c(126, 146), ylim=c(26, 46))
> plot(jpn, col=colcode, add=T)
> title(main=”麻酔科領域専攻医:総採用数2018/麻酔科医師数2014″, sub=”Quantile (Equal-Frequency) Class Intervals”)
> legend(“bottomright”, legend=names(attr(colcode, “table”)), fill=attr(colcode, “palette”), cex=0.6, bty=”n”)
>
> ?pdiscp
> p = seq(0.05, 0.95, by = 0.1)
> prior = c(1, 5.2, 8, 7.2, 4.6, 2.1, 0.7, 0.1, 0, 0)
> prior = prior/sum(prior)
> plot(p, prior, type = “h”, ylab=”Prior Probability”)
>
> data <- c(11,16)
> post
p prior post
[1,] 0.05 0.03 0.00
[2,] 0.15 0.18 0.00
[3,] 0.25 0.28 0.13
[4,] 0.35 0.25 0.48
[5,] 0.45 0.16 0.33
[6,] 0.55 0.07 0.06
[7,] 0.65 0.02 0.00
[8,] 0.75 0.00 0.00
[9,] 0.85 0.00 0.00
[10,] 0.95 0.00 0.00
> pdisc()
pdisc() でエラー: 引数 “data” がありませんし、省略時既定値もありません
> ?pdisc
> library(lattice)
> PRIOR=data.frame(“prior”,p,prior)
> POST=data.frame(“posterior”,p,post)
> names(PRIOR)=c(“Type”,”P”,”Probability”)
> names(POST)=c(“Type”,”P”,”Probability”)
> data=rbind(PRIOR,POST)
>
> xyplot(Probability~P|Type,data=data,layout=c(1,2),
+ type=”h”,lwd=3,col=”black”)
>
> ?beta.select
> quantile2<-list(p=.9, x= .5)
> quantile1<-list(p=.5, x= .3)
> beta.select(quantile1, quantile2)
[1] 3.26 7.19
> a <- 3.26
> b <- 7.18
> s <- 11
> f <- 16
> curve(dbeta(x,a+s, b+f), from =0, to =1, +
+ xlab = “p”, ylab = “Density”, lty = 1, lwd = 4)
エラー: 予想外の ‘=’ です in:
“curve(dbeta(x,a+s, b+f), from =0, to =1, +
xlab =”
> curve(dbeta(x,a+s, b+f), from =0, to = 1, + xlab =”p”, ylab = “Density”, lty = 1, lwd =4)
エラー: 予想外の ‘=’ です in “curve(dbeta(x,a+s, b+f), from =0, to = 1, + xlab =”
> curve(dbeta(x,a+s, b+f), from =0, to = 1, xlab =”p”, ylab = “Density”, lty = 1, lwd =4)
> curve(dbeta(x,s+1, f+1), add =TRUE, lty=2, lwd=4)
> curve(dbeta(x,a,b), add =TRUE, lty=3, lwd=4)
> legend(.7, 4, c(“Prior”, “Likelihood”, “Posterior”), lty=c(3,2,1), lwd=c(3,3,3))
> 1 – pbeta(0.5, a + s, b + f)
[1] 0.06921827
>
> ?pbeta
> qbeta(c(0.05, 0.95), a + s, b + f)
[1] 0.2556027 0.5134840
>
> ps = rbeta(1000, a + s, b + f)
>
> hist(ps,xlab=”p”)
>
> sum(ps >= 0.5)/1000
[1] 0.067
>
> quantile(ps, c(0.05, 0.95))
5% 95%
0.2624984 0.5106304
>
> midpt <-seq(0.05, 0.95, by = 0.1)
> prior <- c(1, 5.2, 8, 7.2, 4.6, 2.1, 0.7, 0.1, 0.0)
> curve(histprior(x, midpt, prior), from =0, to =1, ylab=”Prior density”, ylim=c(0,3))
> curve(histprior(x, midpt, prior), from =0, to =1, ylab=”Prior density”, ylim=c(0.3))
plot.window(…) でエラー: ‘ylim’ の値が不正です
> curve(histprior(x, midpt, prior), from =0, to =1, ylab=”Prior density”, ylim=c(0,.3))
> midpt <-seq(0.05, 0.95, by = 0.1)
> prior <- c(1, 5.2, 8, 7.2, 4.6, 2.1, 0.7, 0.1, 0, 0)
> prior <- prior/sum(prior)
> curve(histprior(x, midpt, prior), from =0, to =1, ylab=”Prior density”, ylim=c(0,.3))
> curve(histprior(x, midpt, prior) * dbeta(x, s+1, f+1), from =0, to = 1, ylab=”Prior density”)
> p<-seq(0,1,length=500)
> post <- histprior(p, midpt, prior)* dbeta(p,s+1, f+1)
> post = post/sum(post)
> ps <- sample(p, replace=TRUE, prob =post)
> hist(ps, xlab=”p”, main =””)
> ?pdiscp
> p<-seq(0.05, 0.95, by =.1)
> prior <- c(1, 5.2, 8, 7.2, 4.6, 2.1, 0.7, 0.1, 0, 0)
> prior <- prior/sum(prior)
> m <- 20; ys <- 0:20
> pred <- pdiscp(p, prior, m, ys)
> round(cbind(0:20, pred), 3)
pred
[1,] 0 0.020
[2,] 1 0.044
[3,] 2 0.069
[4,] 3 0.092
[5,] 4 0.106
[6,] 5 0.112
[7,] 6 0.110
[8,] 7 0.102
[9,] 8 0.089
[10,] 9 0.074
[11,] 10 0.059
[12,] 11 0.044
[13,] 12 0.031
[14,] 13 0.021
[15,] 14 0.013
[16,] 15 0.007
[17,] 16 0.004
[18,] 17 0.002
[19,] 18 0.001
[20,] 19 0.000
[21,] 20 0.000
> ab=c(3.26, 7.19)
> m=20; ys=0:20
> pred=pbetap(ab, m, ys)
>
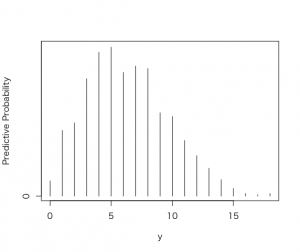
> p=rbeta(1000,3.26, 7.19)
>
> y = rbinom(1000, 20, p)
>
> table(y)
y
0 1 2 3 4 5 6 7 8 9 10 11 12 13 14 15 16 17 18
12 52 58 93 114 118 98 103 101 66 63 44 32 22 13 6 2 1 2
>
> freq=table(y)
> ys=as.integer(names(freq))
> predprob=freq/sum(freq)
> plot(ys,predprob,type=”h”,xlab=”y”,
+ ylab=”Predictive Probability”)
この離散予測分布を90%の確率でカバーする区間によって要約したい。
discint()関数
discint {LearnBayes} R Documentation
Highest probability interval for a discrete distribution
Description
Computes a highest probability interval for a discrete probability distribution
Usage
discint(dist, prob)
Arguments
dist
probability distribution written as a matrix where the first column contain the values and the second column the probabilities
prob
probability content of interest
Value
prob
exact probability content of interval
set
set of values of the probability interval
> dist=cbind(ys,predprob)
>
> covprob=.9
> discint(dist,covprob)
$prob
11
0.91
$set
1 2 3 4 5 6 7 8 9 10 11
1 2 3 4 5 6 7 8 9 10 11
1-11になる確率は91%という結果が得られた。
