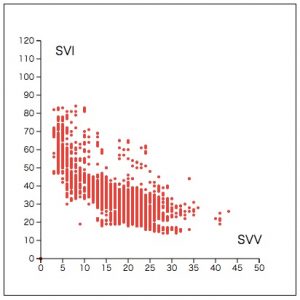
P5.jsに挑戦すると同時に、データの可視化では評判の良いD3.jsに挑戦してみた。
index.html内に
|
1 |
<script src="http://d3js.org/d3.v3.min.js" charset="utf-8"></script> |
で、D3ライブラリの取り込みを行った。別の方法では、
|
1 |
<script type="text/javascript" src="../d3/d3.v3.js"></script> |
として、サブフォルダd3にd3.v3.jsを置く。(もしくはd3.v3.min.js)
グラフはjavascriptファイルの中で、SVGで描くことになる。
SVGファイルのattribute等にアクセスするためにスタイルシート風のnodeの指定に少し戸惑うかもしれない。
慣れれば問題ないが。。。とにかく、グラフ描画に特化しているので、簡単に図が作成できるように軸などが整備されている。また出力がSVGであることから、大変綺麗な図が作成できるし、また最後はイラストレーター等に取り込んで、ベクターファーマットで図を弄ることができそうである。もう少し、極めてみても良さそうだ。
P5.jpがprocessingから発展してきている意味では、Processingユーザーには馴染みやすいが、グラフそのものに特化しているわけではないので、オンライン等で利用できればP5は面白そうである。一方、D3は、グラフ中心でどちらかといううとデザイン系かもしれない。通信などの環境が、もちろんJavaScriptを駆使すればできるんだろうけで、どうなっているかちょっと良くわかっていない。
|
1 2 3 4 5 6 7 8 9 10 11 12 13 14 15 16 17 18 19 20 21 22 23 24 25 26 27 |
//HTMLファイル index.html <html> <head> <meta charset="utf-8"> <title>Sample</title> <script src="http://d3js.org/d3.v3.min.js" charset="utf-8"></script> <style> svg { width: 400px; height: 400px; border: 1px solid black; } .mark { fill: red; stroke: none; } .axis text { font-family: sans-serif; font-size: 11px; } .axis path, .axis line { fill: none; stroke: black; } </style> </head> <body> <div id="myGraph"></div> <script src="js/sample.js"></script> </body> </html> |
|
1 2 3 4 5 6 7 8 9 10 11 12 13 14 15 16 17 18 19 20 21 22 23 24 25 26 27 28 29 30 31 32 33 34 35 36 37 38 39 40 41 42 43 44 45 46 47 48 49 50 51 52 53 54 55 56 57 58 59 60 61 62 63 64 65 66 67 68 69 70 71 72 73 74 75 76 |
sample.js var dataSet = []; // X,Y軸を表示できるようにグラフの周囲にマージンを確保する var margin = {top: 50, right: 50, bottom: 50, left: 50}; var width = 400 - margin.left - margin.right; var height = 400 - margin.top - margin.bottom; d3.csv("./js/2013_8_24.csv", function(error, dataSet){ console.log(dataSet); // SVGの表示領域を生成 var svg = d3.select("#myGraph") .append("svg") .attr("width", width + margin.left + margin.right) .attr("height", height + margin.top + margin.bottom) .append("g") .attr("transform", "translate(" + margin.left + ", " + margin.top + ")"); // スケール関数を作成。 var xScale = d3.scale.linear() .domain([0,50]) .range([0,width]); var yScale = d3.scale.linear() .domain([0,120]) .range([height,0]); // 散布図を描画 svg.selectAll("circle") .data(dataSet) .enter() .append("circle") .attr("r", 2) .attr("fill", "red") .attr("cx", function(d){ return xScale(d.SVV); }) .attr("cy", function(d){ return yScale(d.SVI); }); // Y軸を描画 svg.append("g") .attr("class", "axis") .call(d3.svg.axis() .scale(yScale) .orient("left") ); // X軸を描画 svg.append("g") .attr("class", "axis") .attr("transform", "translate(0," + height + ")") .call(d3.svg .axis() .scale(xScale) .orient("bottom") ); // X軸凡例 svg.append("g") .append("text") .attr("x", 270) .attr("y", 280) .text("SVV"); // Y軸凡例 svg.append("g") .append("text") .attr("x", 20) .attr("y", 20) .text("SVI"); }) |
