|
1 2 3 4 5 6 7 8 9 10 11 12 13 14 15 16 17 18 19 20 21 22 23 24 25 26 27 28 29 30 31 32 33 34 35 36 37 38 39 40 41 42 43 44 45 46 47 48 49 50 51 52 53 54 55 56 57 58 59 60 61 62 63 64 65 66 67 68 69 70 71 72 73 74 75 76 77 78 79 80 81 82 83 84 85 86 87 88 89 90 91 92 93 94 95 96 97 98 99 100 101 102 103 104 105 106 107 108 109 110 111 112 113 114 115 116 117 118 119 120 121 122 123 124 125 126 127 128 129 130 131 132 133 134 135 136 137 138 139 140 141 142 143 144 145 146 147 148 149 150 151 152 153 154 155 156 157 158 159 160 161 162 163 164 165 166 167 168 169 170 171 172 173 174 175 176 177 178 179 180 181 182 183 184 185 186 187 188 189 190 191 |
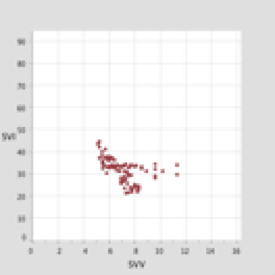
//-------------------------------------------------------- // Simple XY-plot #3 経時的データプロット //-------------------------------------------------------- FloatTable data; float plotX1, plotY1; float plotX2, plotY2; float labelX, labelY; int row = 0; int rowCount = 0; float xdataMin, xdataMax; float ydataMin, ydataMax; int xvolumeInterval = 2; int yvolumeInterval = 10; int xvolumeIntervalMinor = 1; int yvolumeIntervalMinor = 1; PFont plotFont; //-------------------- int col_x = 1; int col_y = 0; //-------------------- void setup() { セットアップ関数 size(405, 405); data = new FloatTable("data.tsv"); xdataMin = 0; ydataMin = 0; xdataMax = data.getColumnMax(col_x)+5; ydataMax = data.getColumnMax(col_y)+50; plotX1 = 50; plotX2 = width - plotX1; plotY1 = 50; plotY2 = height - plotY1; labelX = 15; labelY = height - 10; plotFont = createFont("SansSerif", 20); textFont(plotFont); smooth(); } void draw() { グラフ描画関数 background(224); // Show the plot area as a white box fill(255); rectMode(CORNERS); noStroke(); rect(plotX1, plotY1, plotX2, plotY2); xdrawVolumeLabels(); ydrawVolumeLabels(); drawxLabels(); drawyLabels(); drawAxisLabels(); // Draw the data strokeWeight(5); stroke(#5679C1); データプロット描画を経時的に for (int row = 0; row < rowCount; row++) { stroke(#bd1f30); drawDataPoints(0, row); } rowCount = rowCount + 1; } // Draw the data points void drawDataPoints(int col, int row) { データ描画関数 if (data.isValid(row, col_x) & data.isValid(row, col_x)) { float value_x = data.getFloat(row, col_x); float value_y = data.getFloat(row, col_y); float x = map(value_x, xdataMin, xdataMax, plotX1, plotX2); float y = map(value_y, ydataMin, ydataMax, plotY2, plotY1); point(x, y); } } void xdrawVolumeLabels() { x軸ボリュームラベル fill(0); textSize(10); textAlign(RIGHT); stroke(128); strokeWeight(1); for (float v = xdataMin; v <= xdataMax; v += xvolumeIntervalMinor) { if (v % xvolumeIntervalMinor == 0) { float x = map(v, xdataMax, xdataMin, plotY2, plotY1); if (v % xvolumeInterval == 0) { float textOffset = textAscent()/2; if (v == xdataMin) { textOffset = 0; } else if (v == xdataMax) { textOffset = textAscent(); } text(floor(v), x + textOffset, plotY2 + 20); line(x, plotY2 + 4, x, plotY2); // Draw major tick } else { line(x, plotY2 + 2, x, plotY2); // Draw minor tick } } } } void ydrawVolumeLabels() { y軸ボリュームラベル fill(0); textSize(10); textAlign(RIGHT); stroke(128); strokeWeight(1); for (float v = ydataMin; v <= ydataMax; v += yvolumeIntervalMinor) { if (v % yvolumeIntervalMinor == 0) { float y = map(v, ydataMin, ydataMax, plotY2, plotY1); if (v % yvolumeInterval == 0) { float textOffset = textAscent()/2; if (v == ydataMin) { textOffset = 0; } else if (v == ydataMax) { textOffset = textAscent(); } text(floor(v), plotX1 - 10, y + textOffset); line(plotX1 - 4, y, plotX1, y); } else { line(plotX1 - 2, y, plotX1, y); } } } } void drawxLabels() { x軸ラベル fill(0); // Use thin, gray lines to draw the grid stroke(224); strokeWeight(1); for (float v = xdataMin; v <= xdataMax; v += xvolumeIntervalMinor) { if (v % xvolumeIntervalMinor == 0) { float x = map(v, xdataMax, xdataMin, plotY2, plotY1); if (v % xvolumeInterval == 0) { if (v == xdataMin) { } else if (v == xdataMax) { } line(x, plotY1, x, plotY2); } } } } void drawyLabels() { y軸ラベル fill(0); // Use thin, gray lines to draw the grid stroke(224); strokeWeight(1); for (float v = ydataMin; v <= ydataMax; v += yvolumeIntervalMinor) { if (v % yvolumeIntervalMinor == 0) { float y = map(v, ydataMin, ydataMax, plotY2, plotY1); if (v % yvolumeInterval == 0) { if (v == ydataMin) { } else if (v == ydataMax) { } line(plotX1, y, plotX2, y); } } } } void drawAxisLabels() { 軸ラベル fill(0); textSize(13); textLeading(15); textAlign(CENTER, CENTER); // Use \n (enter/linefeed) to break the text into separate lines text("SVI", labelX, (plotY1+plotY2)/2); textAlign(CENTER); text("SVV", (plotX1+plotX2)/2, labelY); } |
