————————————
ベイズ推論による機械学習入門 須山 敦志 著 を読む
————————————
ガウス混合モデルへ:
————————————
Juliaの問題点は、ver.0.6からver.0.7、そしてver.1.0以上と、いっぱい取り扱い方や関数が変化して、もちろん進化系だから仕方ないにせよ、学習サンプルとversionは合致させないと、とんでもないことになる。
ということで、ver.0.7では全然パニックなので、これからは、ver.0.6.4にダウングレード!
パッケージモードは無くなるので動揺するが、よく考えてみると、複雑なことを考えずに、そのままモジュールをどんどん入力していけばよいわけだ。
|
1 2 3 4 5 6 7 8 9 |
$ julia _ _ _ _(_)_ | A fresh approach to technical computing (_) | (_) (_) | Documentation: https://docs.julialang.org _ _ _| |_ __ _ | Type "?help" for help. | | | | | | |/ _` | | | | |_| | | | (_| | | Version 0.6.4 (2018-07-09 19:09 UTC) _/ |\__'_|_|_|\__'_| | Official http://julialang.org/ release |__/ | x86_64-apple-darwin14.5.0 |
重要となるのは、Pkg.installed()命令で、すでにインストールされているパッケージをチェックできること。
加えて、ver 0.6をJupyter Notebookで動くようにしてからは、anaconda側で、必要なscikit-learnやscipy等をインストールしておく。
|
1 2 3 4 5 6 7 8 9 10 11 12 13 14 15 16 17 18 19 20 21 22 23 24 25 26 27 28 29 30 31 32 33 34 35 36 37 |
julia> Pkg.installed() Dict{String,VersionNumber} with 82 entries: "ForwardDiff" => v"0.7.5" "AxisAlgorithms" => v"0.3.0" "Juno" => v"0.4.1" "OffsetArrays" => v"0.6.0" "LegacyStrings" => v"0.4.1" "IndirectArrays" => v"0.4.2" "Nullables" => v"0.0.8" "ZMQ" => v"0.6.4" "DataStructures" => v"0.8.4" "Compat" => v"2.1.0" "CategoricalArrays" => v"0.3.13" "Calculus" => v"0.4.1" "Measures" => v"0.2.0" "ShowItLikeYouBuildIt" => v"0.2.0" "StatsFuns" => v"0.6.1" "CoupledFields" => v"0.1.0" "DataFrames" => v"0.11.7" "SpecialFunctions" => v"0.6.0" "TranscodingStreams" => v"0.5.4" "Blosc" => v"0.5.1" "Showoff" => v"0.2.1" ? => ? julia> Pkg.add("SpecialFunctions") INFO: Package SpecialFunctions is already installed julia> Pkg.add("Distributions") INFO: Package Distributions is already installed julia> Pkg.add("PDMats") INFO: Package PDMats is already installed julia> using IJulia julia> IJulia.notebook() |
あとは、Jupyterから一気に入力:まずはGaussianMixtureModel.jlパッケージのコードをドンと実行。
|
1 2 3 4 5 6 7 8 9 10 11 12 13 14 15 16 17 18 19 20 21 22 23 24 25 26 27 28 29 30 31 32 33 34 35 36 37 38 39 40 41 42 43 44 45 46 |
""" Bayesian Gaussian Mixture Model """ module GaussianMixtureModel using StatsFuns: logsumexp using SpecialFunctions: digamma using Distributions using PDMats export GW, BGMM, Gauss, GMM export sample_GMM, sample_data, winner_takes_all export learn_GS, learn_CGS, learn_VI #################### ## Types struct GW # Parameters of Gauss Wisahrt distribution beta::Float64 m::Vector{Float64} nu::Float64 W::Matrix{Float64} end 途中省略 """ Compute posterior distributions via collapsed Gibbs sampling. """ function learn_CGS(X::Matrix{Float64}, prior_bgmm::BGMM, max_iter::Int) # initialisation S = init_S(X, prior_bgmm) bgmm = add_stats(prior_bgmm, X, S) VB = NaN * zeros(max_iter) # inference for i in 1 : max_iter # directly sample S S, bgmm = sample_S_CGS(S, X, bgmm) # calc VB VB[i] = calc_ELBO(X, prior_bgmm, bgmm) end return S, bgmm, VB end end |
Out: GaussianMixtureModel
次のおまじないはいるのかいらないのかわからないが、
|
1 |
using GaussianMixtureModel |
では、demo_GaussianMixtureModel.jlのコードを少しずつ、動作をチェックしながら入力していく。
|
1 2 3 4 5 6 7 |
################################### ## Example code ## for Bayesian Gaussin Mixture Model using PyPlot, PyCall push!(LOAD_PATH,"/Users/******/Desktop/BayesBook-master/src/GaussianMixtureModel/src") import GaussianMixtureModel |
|
1 2 3 4 5 6 7 8 9 10 11 12 13 14 15 16 17 18 19 20 21 22 23 24 25 26 |
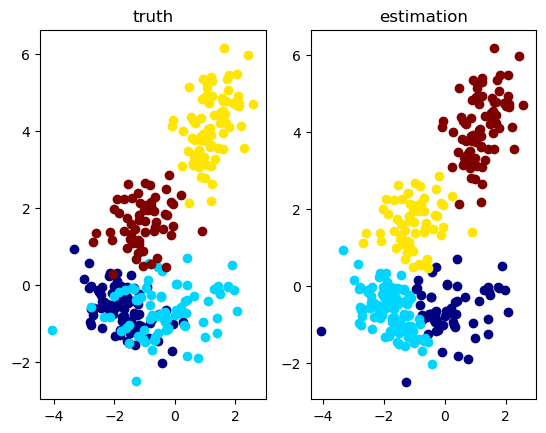
""" Visualize data & estimation in 2D space. """ function visualize_2D(X::Matrix{Float64}, S::Matrix{Float64}, S_est::Matrix{Float64}, text) cmp = get_cmap("jet") K1 = size(S, 1) K2 = size(S_est, 1) col1 = [pycall(cmp.o, PyAny, Int(round(val)))[1:3] for val in linspace(0,255,K1)] col2 = [pycall(cmp.o, PyAny, Int(round(val)))[1:3] for val in linspace(0,255,K2)] f, (ax1, ax2) = subplots(1,2,num=text) f[:clf]() f, (ax1, ax2) = subplots(1,2,num=text) for k in 1 : K1 ax1[:scatter](X[1, S[k,:].==1], X[2, S[k,:].==1], color=col1[k]) end ax1[:set_title]("truth") for k in 1 : K2 ax2[:scatter](X[1, S_est[k,:].==1], X[2, S_est[k,:].==1], color=col2[k]) end ax2[:set_title]("estimation") end |
Out: visualize_2D
|
1 2 3 4 5 6 7 8 9 10 11 12 13 14 15 16 17 18 19 20 21 22 23 24 25 26 27 28 29 30 31 32 33 34 35 36 37 38 39 |
""" Run a test script for 2D data clustering. """ function test_2D() ## set model D = 2 # data dimension K = 4 # number of mixture components alpha = 100.0 * ones(K) beta = 0.1 m = zeros(D) nu = D + 1.0 W = eye(D) cmp = [GaussianMixtureModel.GW(beta, m, nu, W) for _ in 1 : K] bgmm = GaussianMixtureModel.BGMM(D, K, alpha, cmp) ## generate data N = 300 gmm = GaussianMixtureModel.sample_GMM(bgmm) X, S = GaussianMixtureModel.sample_data(gmm, N) ## inference max_iter = 100 tic() S_est, post_bgmm, VB = GaussianMixtureModel.learn_VI(X, bgmm, max_iter) #S_est, post_bgmm, VB = GaussianMixtureModel.learn_GS(X, bgmm, max_iter) #S_est, post_bgmm, VB = GaussianMixtureModel.learn_CGS(X, bgmm, max_iter) toc() ## plot visualize_2D(X, S, GaussianMixtureModel.winner_takes_all(S_est), "2D plot") # VB check figure("ELBO") clf() plot(VB) ylabel("ELBO") xlabel("iterations") show() end |
Out: test_2D
|
1 |
test_2D() |
