Python力増強の続き:
step03_fig3_red_to_blue_py.pyde
|
1 2 3 4 5 6 7 8 9 10 11 12 13 14 15 16 17 18 19 20 21 22 23 24 25 26 27 28 29 30 31 32 33 34 35 36 37 38 39 40 41 42 43 44 45 46 47 48 49 50 51 52 53 54 55 56 57 58 59 60 61 62 63 64 65 |
import Table dataMin = 0 dataMax = 0 def setup(): global locationTable global mapImage global rowCount global dataTable global dataMin global dataMax size(640, 400) mapImage = loadImage("map.png") locationTable = Table.Table("locations.tsv") rowCount = locationTable.getRowCount() #print rowCount dataTable = Table.Table("random.tsv") # Find the minimum and maximum values for row in range(rowCount): value = dataTable.getFloat(row, 1) if value > dataMax: dataMax = value if value < dataMin: dataMin = value def draw(): global locationTable global mapImage global rowCount global dataTable global dataMin global dataMax background(255) #print(rowCount) image(mapImage, 0, 0) fill(192, 0, 0) noStroke() for row in range(0,rowCount): abbrev = dataTable.getRowName(row) x = locationTable.getFloat2(abbrev, 1) y = locationTable.getFloat2(abbrev, 2) drawData(x, y, abbrev) # Map the size of the ellipse to the data value def drawData(x, y, abbrev): global dataTable global dataMin global dataMax #Get data value for state value = dataTable.getFloat2(abbrev, 1) percent = norm(value, dataMin, dataMax) #Re-map the value to a number between 2 and 40 between = lerpColor('#FF4422', '#4422CC', percent) #red to blue fill(between) ellipse(x, y, 15, 15) |
step04_fig4_blue_green_py.pyde
|
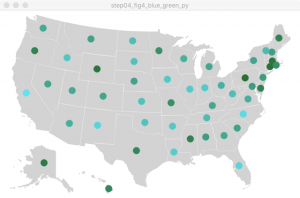
1 2 3 4 5 6 7 8 9 10 11 12 13 14 15 16 17 18 19 20 21 22 23 24 25 26 27 28 29 30 31 32 33 34 35 36 37 38 39 40 41 42 43 44 45 46 47 48 49 50 51 52 53 54 55 56 57 58 59 60 61 62 63 64 65 66 67 68 69 70 71 |
import Table dataMin = 0 dataMax = 0 def setup(): global locationTable global mapImage global rowCount global dataTable global dataMin global dataMax size(640, 400) mapImage = loadImage("map.png") locationTable = Table.Table("locations.tsv") rowCount = locationTable.getRowCount() print rowCount dataTable = Table.Table("random.tsv") # Find the minimum and maximum values for row in range(rowCount): value = dataTable.getFloat(row, 1) if value > dataMax: dataMax = value if value < dataMin: dataMin = value def draw(): global locationTable global mapImage global rowCount global dataTable global dataMin global dataMax background(255) #print(rowCount) image(mapImage, 0, 0) fill(192, 0, 0) noStroke() for row in range(0,rowCount): abbrev = dataTable.getRowName(row) x = locationTable.getFloat2(abbrev, 1) y = locationTable.getFloat2(abbrev, 2) drawData(x, y, abbrev) # Map the size of the ellipse to the data value def drawData(x, y, abbrev): global dataTable global dataMin global dataMax #Get data value for state value = dataTable.getFloat2(abbrev, 1) percent = norm(value, dataMin, dataMax) between = lerpColor(rgb('#296F34'), rgb('#61E2F0'), percent) fill(between) ellipse(x, y, 15, 15) def rgb(col): r = int(col[1:3], 16) g = int(col[3:5], 16) b = int(col[5:7], 16) return color(r, g, b) |
step05_fig5_blue_green_hsb_py.pyde
|
1 2 3 4 5 6 7 8 9 10 11 12 13 14 15 16 17 18 19 20 21 22 23 24 25 26 27 28 29 30 31 32 33 34 35 36 37 38 39 40 41 42 43 44 45 46 47 48 49 50 51 52 53 54 55 56 57 58 59 60 61 62 63 64 65 66 67 68 69 70 71 |
import Table dataMin = 0 dataMax = 0 def setup(): global locationTable global mapImage global rowCount global dataTable global dataMin global dataMax size(640, 400) mapImage = loadImage("map.png") locationTable = Table.Table("locations.tsv") rowCount = locationTable.getRowCount() #print rowCount dataTable = Table.Table("random.tsv") # Find the minimum and maximum values for row in range(rowCount): value = dataTable.getFloat(row, 1) if value > dataMax: dataMax = value if value < dataMin: dataMin = value def draw(): global locationTable global mapImage global rowCount global dataTable global dataMin global dataMax background(255) #print(rowCount) image(mapImage, 0, 0) fill(192, 0, 0) noStroke() for row in range(0,rowCount): abbrev = dataTable.getRowName(row) x = locationTable.getFloat2(abbrev, 1) y = locationTable.getFloat2(abbrev, 2) drawData(x, y, abbrev) # Map the size of the ellipse to the data value def drawData(x, y, abbrev): global dataTable global dataMin global dataMax #Get data value for state value = dataTable.getFloat2(abbrev, 1) percent = norm(value, dataMin, dataMax) between = lerpColor(rgb('#296F34'), rgb('#61E2F0'), percent, HSB) fill(between) ellipse(x, y, 15, 15) def rgb(col): r = int(col[1:3], 16) g = int(col[3:5], 16) b = int(col[5:7], 16) return color(r, g, b) |
step06_fig6_sided_range_py.pyde
|
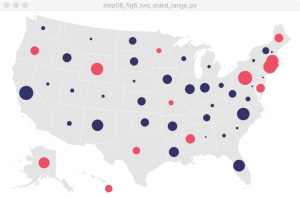
1 2 3 4 5 6 7 8 9 10 11 12 13 14 15 16 17 18 19 20 21 22 23 24 25 26 27 28 29 30 31 32 33 34 35 36 37 38 39 40 41 42 43 44 45 46 47 48 49 50 51 52 53 54 55 56 57 58 59 60 61 62 63 64 65 66 67 68 69 70 71 72 73 74 75 76 |
import Table dataMin = 0 dataMax = 0 def setup(): global locationTable global mapImage global rowCount global dataTable global dataMin global dataMax size(640, 400) mapImage = loadImage("map.png") locationTable = Table.Table("locations.tsv") rowCount = locationTable.getRowCount() print rowCount dataTable = Table.Table("random.tsv") # Find the minimum and maximum values for row in range(rowCount): value = dataTable.getFloat(row, 1) if value > dataMax: dataMax = value if value < dataMin: dataMin = value; def draw(): global locationTable global mapImage global rowCount global dataTable global dataMin global dataMax background(255) #print(rowCount) image(mapImage, 0, 0) fill(192, 0, 0) noStroke() for row in range(0,rowCount): abbrev = dataTable.getRowName(row) x = locationTable.getFloat2(abbrev, 1) y = locationTable.getFloat2(abbrev, 2) drawData(x, y, abbrev) # Map the size of the ellipse to the data value def drawData(x, y, abbrev): global dataTable global dataMin global dataMax #Get data value for state value = dataTable.getFloat2(abbrev, 1) diameter = 0 if value >= 0: diameter = map(value, 0, dataMax, 3, 30) fill('#333366'); #blue else: diameter = map(value, 0, dataMin, 3, 30) fill('#ec5166'); #red ellipse(x, y, diameter, diameter) #between = lerpColor(rgb('#296F34'), rgb('#61E2F0'), percent, HSB) def rgb(col): r = int(col[1:3], 16) g = int(col[3:5], 16) b = int(col[5:7], 16) return color(r, g, b) |
step07_fig7_two_sided_alpha.pyde
|
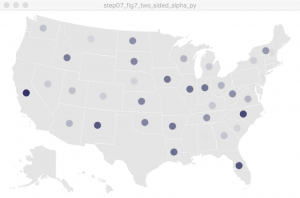
1 2 3 4 5 6 7 8 9 10 11 12 13 14 15 16 17 18 19 20 21 22 23 24 25 26 27 28 29 30 31 32 33 34 35 36 37 38 39 40 41 42 43 44 45 46 47 48 49 50 51 52 53 54 55 56 57 58 59 60 61 62 63 64 65 66 67 68 69 70 71 72 73 74 75 76 77 |
import Table dataMin = 0 dataMax = 0 def setup(): global locationTable global mapImage global rowCount global dataTable global dataMin global dataMax size(640, 400) mapImage = loadImage("map.png") locationTable = Table.Table("locations.tsv") rowCount = locationTable.getRowCount() print rowCount dataTable = Table.Table("random.tsv") # Find the minimum and maximum values for row in range(rowCount): value = dataTable.getFloat(row, 1) if value > dataMax: dataMax = value if value < dataMin: dataMin = value def draw(): global locationTable global mapImage global rowCount global dataTable global dataMin global dataMax background(255) #print(rowCount) image(mapImage, 0, 0) fill(192, 0, 0) noStroke() for row in range(0,rowCount): abbrev = dataTable.getRowName(row) x = locationTable.getFloat2(abbrev, 1) y = locationTable.getFloat2(abbrev, 2) drawData(x, y, abbrev) # Map the size of the ellipse to the data value def drawData(x, y, abbrev): global dataTable global dataMin global dataMax #Get data value for state value = dataTable.getFloat2(abbrev, 1) if value >= 0: a = map(value, 0, dataMax, 0, 255) fill(rgb('#333366'), a); #blue else: a = map(value, 0, dataMax, 0, 255) fill(rgb('#ec5166'), a); #red ellipse(x, y, 15, 15) #between = lerpColor(rgb('#296F34'), rgb('#61E2F0'), percent, HSB) def rgb(col): r = int(col[1:3], 16) g = int(col[3:5], 16) b = int(col[5:7], 16) return color(r, g, b) |


