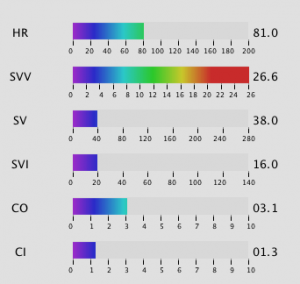
カラーインジケーターのバーグラフを作成するクラスBarGraphを解説する。

setup()関数内で、BarGraphのインスタンスを生成して、コンストラクタに初期値を設定する。
|
1 2 |
barGraph_# = new BarGraph(最小値, 最大値, メジャー軸メモリ, マイナー軸メモリ, グラフ左上角x座標値, グラフ左上角y座標値, 幅, 高さ); |
次にdraw()関数内で、まとめて複数のバーグラフを作成するdraw_bargraphs()関数を呼び出す。draw_bargraphs()関数では、
BarGraphのインスタンスにインスタンスメソッドを以下のように送って、ラベル、X軸メモリ、x軸罫線、背景、値の表示、を指定して描画する。
|
1 2 3 4 5 |
barGraph_1.barLabels("HR"); barGraph_1.bar_xdrawVolumeLabels(); barGraph_1.bar_drawxLabels(); barGraph_1.backBar(); barGraph_1.bar_draw(HR, 200, 200); |
ーーーーーーーーーーーーーーーーーーーーーーーーーーーーーーーーーーー
|
1 2 3 4 5 6 7 8 9 10 11 12 13 14 15 16 17 18 19 20 21 22 23 24 25 26 27 28 29 30 31 32 33 34 35 36 37 38 39 40 41 42 43 44 45 46 47 48 49 50 51 52 53 54 |
void setup(){ ........... barGraph_1 = new BarGraph(0, 200, 20, 10, 500, 170, 200, 20); barGraph_2 = new BarGraph(0, 26, 2, 1, 500, 220, 200, 20); barGraph_3 = new BarGraph(0, 280, 40, 20, 500, 270, 200, 20); barGraph_4 = new BarGraph(0, 140, 20, 1, 500, 320, 200, 20); barGraph_5 = new BarGraph(0, 10, 1, 1, 500, 370, 200, 20); barGraph_6 = new BarGraph(0, 10, 1, 1, 500, 420, 200, 20); ........... void draw(){ ......... draw_bargraphs(); ......... } void draw_bargraphs() { barGraph_1.barLabels("HR"); barGraph_1.bar_xdrawVolumeLabels(); barGraph_1.bar_drawxLabels(); barGraph_1.backBar(); barGraph_1.bar_draw(HR, 200, 200); barGraph_2.barLabels("SVV"); barGraph_2.bar_xdrawVolumeLabels(); barGraph_2.bar_drawxLabels(); barGraph_2.backBar(); barGraph_2.bar_draw(SVV, 200, 26); barGraph_3.barLabels("SV"); barGraph_3.bar_xdrawVolumeLabels(); barGraph_3.bar_drawxLabels(); barGraph_3.backBar(); barGraph_3.bar_draw(SV, 200, 280); barGraph_4.barLabels("SVI"); barGraph_4.bar_xdrawVolumeLabels(); barGraph_4.bar_drawxLabels(); barGraph_4.backBar(); barGraph_4.bar_draw(SVI, 240, 140); barGraph_5.barLabels("CO"); barGraph_5.bar_xdrawVolumeLabels(); barGraph_5.bar_drawxLabels(); barGraph_5.backBar(); barGraph_5.bar_draw(CO, 200, 10); barGraph_6.barLabels("CI"); barGraph_6.bar_xdrawVolumeLabels(); barGraph_6.bar_drawxLabels(); barGraph_6.backBar(); barGraph_6.bar_draw(CI, 200, 10); } |
|
1 2 3 4 5 6 7 8 9 10 11 12 13 14 15 16 17 18 19 20 21 22 23 24 25 26 27 28 29 30 31 32 33 34 35 36 37 38 39 40 41 42 43 44 45 46 47 48 49 50 51 52 53 54 55 56 57 58 59 60 61 62 63 64 65 66 67 68 69 70 71 72 73 74 75 76 77 78 79 80 81 82 83 84 85 86 87 88 89 90 91 92 93 94 95 96 97 98 99 100 101 102 |
class BarGraph { float bar_xdataMin = 0; float bar_xdataMax = 0; float bar_xvolumeInterval = 0; float bar_xvolumeIntervalMinor = 0; float bar_plotX1 = 0; float bar_plotY1 = 0; float bar_plotX2 = 0; float bar_plotY2 = 0; // Constructor BarGraph (float _bar_xdataMin, float _bar_xdataMax, float _bar_xvolumeInterval, float _bar_xvolumeIntervalMinor, float _bar_plotX1, float _bar_plotY1, float _bar_plotX_W, float _bar_plotY_W) { bar_xdataMin = _bar_xdataMin; bar_xdataMax = _bar_xdataMax; bar_xvolumeInterval = _bar_xvolumeInterval; bar_xvolumeIntervalMinor = _bar_xvolumeIntervalMinor; bar_plotX1 = _bar_plotX1; bar_plotY1 = _bar_plotY1; bar_plotX2 = _bar_plotX1+_bar_plotX_W; bar_plotY2 = _bar_plotY1+_bar_plotY_W; } void bar_draw(float _data, int _divisor, float _index) { colorMode(HSB); for (int i = 0; i <= 200; i++) { if (i <_data*_divisor/_index) { int c = 255 * i / _divisor; stroke(200-c, 200, 200); line(bar_plotX1+i, bar_plotY2-1, bar_plotX1+i, bar_plotY1+1); } } fill(0); textSize(13); textLeading(15); textAlign(LEFT, CENTER); text(nf(_data, 2, 1), bar_plotX2+5, bar_plotY1+10); } void bar_xdrawVolumeLabels() { fill(0); textSize(8); textAlign(RIGHT); stroke(128); strokeWeight(1); for (float v = bar_xdataMin; v <= bar_xdataMax; v += bar_xvolumeInterval) { if (v % bar_xvolumeInterval == 0) { float x = map(v, bar_xdataMin, bar_xdataMax, bar_plotX1, bar_plotX2); if (v % bar_xvolumeInterval == 0) { float textOffset = textAscent()/2; if (v == bar_xdataMin) { textOffset = 0; } else if (v == bar_xdataMax) { textOffset = textAscent(); } text(floor(v), x + textOffset, bar_plotY2 + 16); line(x, bar_plotY2, x, bar_plotY2+4); } else { line(x, bar_plotY1 + 2, x, bar_plotY1 + 6); } } } } void bar_drawxLabels() { fill(0); stroke(0); strokeWeight(1); for (float v = bar_xdataMin; v <= bar_xdataMax; v += bar_xvolumeIntervalMinor) { if (v % bar_xvolumeIntervalMinor == 0) { float x = map(v, bar_xdataMin, bar_xdataMax, bar_plotX1, bar_plotX2); if (v % bar_xvolumeInterval == 0) { if (v == bar_xdataMin) { } else if (v == bar_xdataMax) { } line(x, bar_plotY2+2, x, bar_plotY2+6); } } } } void backBar() { fill(#D8D8D8); noStroke(); rect(bar_plotX1, bar_plotY1, bar_plotX2, bar_plotY2); } void barLabels(String _label) { fill(0); textSize(13); textLeading(15); textAlign(CENTER, CENTER); text(_label, bar_plotX1-60, bar_plotY1+10); textAlign(CENTER, CENTER); } } |